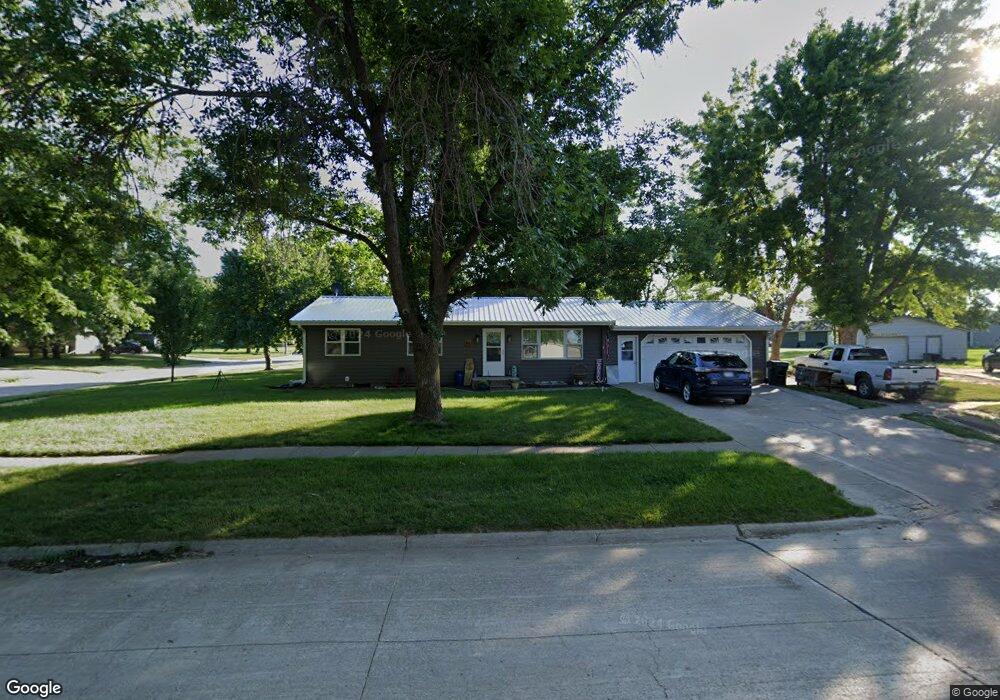
94 Mulberry Cir Niobrara, NE 68760
Estimated Value: $94,121 - $130,000
--
Bed
2
Baths
1,008
Sq Ft
$110/Sq Ft
Est. Value
About This Home
This home is located at 94 Mulberry Cir, Niobrara, NE 68760 and is currently estimated at $111,030, approximately $110 per square foot. 94 Mulberry Cir is a home located in Knox County with nearby schools including Niobrara Elementary School and Niobrara Secondary School.
Ownership History
Date
Name
Owned For
Owner Type
Purchase Details
Closed on
Oct 1, 2021
Sold by
Walton Allen L and Walton Amy E
Bought by
Sternberg Alex and Bauer Sarah Lynn
Current Estimated Value
Home Financials for this Owner
Home Financials are based on the most recent Mortgage that was taken out on this home.
Original Mortgage
$72,750
Outstanding Balance
$66,341
Interest Rate
2.8%
Mortgage Type
New Conventional
Estimated Equity
$44,689
Purchase Details
Closed on
Jul 23, 2021
Sold by
Johnson David and Johnson David R
Bought by
Walton Allen L and Walton Amy E
Purchase Details
Closed on
Apr 1, 2016
Sold by
Stark Bruce A and Stark Jill E
Bought by
Johnson David
Home Financials for this Owner
Home Financials are based on the most recent Mortgage that was taken out on this home.
Original Mortgage
$55,321
Interest Rate
3.71%
Mortgage Type
New Conventional
Purchase Details
Closed on
Aug 5, 2006
Sold by
Peters Sharla L
Bought by
Stark Bruce A and Stark Jill E
Create a Home Valuation Report for This Property
The Home Valuation Report is an in-depth analysis detailing your home's value as well as a comparison with similar homes in the area
Home Values in the Area
Average Home Value in this Area
Purchase History
| Date | Buyer | Sale Price | Title Company |
|---|---|---|---|
| Sternberg Alex | $75,000 | Cedar Title & Escrow | |
| Walton Allen L | $71,000 | None Available | |
| Johnson David | -- | Ne Ne Titile Escrow | |
| Stark Bruce A | $58,000 | -- |
Source: Public Records
Mortgage History
| Date | Status | Borrower | Loan Amount |
|---|---|---|---|
| Open | Sternberg Alex | $72,750 | |
| Previous Owner | Johnson David | $55,321 |
Source: Public Records
Tax History Compared to Growth
Tax History
| Year | Tax Paid | Tax Assessment Tax Assessment Total Assessment is a certain percentage of the fair market value that is determined by local assessors to be the total taxable value of land and additions on the property. | Land | Improvement |
|---|---|---|---|---|
| 2024 | $941 | $76,045 | $8,345 | $67,700 |
| 2023 | $1,128 | $67,415 | $8,345 | $59,070 |
| 2022 | $1,065 | $62,055 | $5,215 | $56,840 |
| 2021 | $1,080 | $61,575 | $4,735 | $56,840 |
| 2020 | $1,015 | $56,425 | $3,505 | $52,920 |
| 2019 | $1,011 | $56,425 | $3,505 | $52,920 |
| 2018 | $1,010 | $55,185 | $3,505 | $51,680 |
| 2017 | $983 | $55,185 | $3,505 | $51,680 |
| 2016 | $974 | $55,750 | $3,505 | $52,245 |
| 2015 | $992 | $55,750 | $3,505 | $52,245 |
| 2014 | $907 | $49,595 | $2,105 | $47,490 |
| 2013 | $865 | $46,795 | $2,105 | $44,690 |
Source: Public Records
Map
Nearby Homes
- 34 Hackberry Heights
- 41 Hackberry Heights
- Lazy River Acre Lots 3 4 9
- 5306 Spruce St
- 5406 Main St
- 528 Ave
- 89331 518th Ave
- 31317 405th Ave
- 2 Rayder Swanson Rd
- 1 Rayder Swanson Rd
- 88192 523 Ave
- 900 6th St
- 811 Cedar St
- 1006 11th St
- 1007 Chestnut St
- 612 9th St
- 109 N 2nd St
- 314 8th St
- 1314 Chestnut St
- 311 3rd Ave