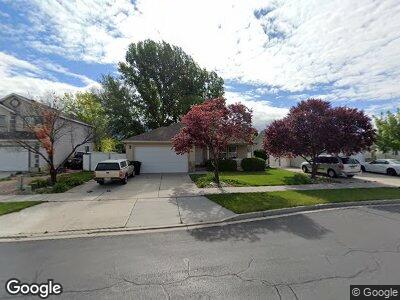
94 N 2830 W Provo, UT 84601
Lakeview NeighborhoodEstimated Value: $491,000 - $507,000
3
Beds
2
Baths
1,650
Sq Ft
$302/Sq Ft
Est. Value
About This Home
This home is located at 94 N 2830 W, Provo, UT 84601 and is currently estimated at $498,396, approximately $302 per square foot. 94 N 2830 W is a home located in Utah County with nearby schools including Dixon Middle School, Provo High School, and Freedom Preparatory Academy.
Ownership History
Date
Name
Owned For
Owner Type
Purchase Details
Closed on
Nov 7, 2002
Sold by
Hubble Homes Llc
Bought by
Mack Dennis L and Mack Charlotte S
Current Estimated Value
Home Financials for this Owner
Home Financials are based on the most recent Mortgage that was taken out on this home.
Original Mortgage
$131,100
Outstanding Balance
$57,844
Interest Rate
5.88%
Estimated Equity
$440,723
Purchase Details
Closed on
Aug 12, 2002
Sold by
The Rivers At Provo Llc
Bought by
Hubble Homes Llc
Create a Home Valuation Report for This Property
The Home Valuation Report is an in-depth analysis detailing your home's value as well as a comparison with similar homes in the area
Home Values in the Area
Average Home Value in this Area
Purchase History
| Date | Buyer | Sale Price | Title Company |
|---|---|---|---|
| Mack Dennis L | -- | First American Title Co | |
| Hubble Homes Llc | -- | Inwest Title Services Inc |
Source: Public Records
Mortgage History
| Date | Status | Borrower | Loan Amount |
|---|---|---|---|
| Closed | Mack Dennis L | $58,200 | |
| Open | Mack Dennis L | $131,100 |
Source: Public Records
Tax History Compared to Growth
Tax History
| Year | Tax Paid | Tax Assessment Tax Assessment Total Assessment is a certain percentage of the fair market value that is determined by local assessors to be the total taxable value of land and additions on the property. | Land | Improvement |
|---|---|---|---|---|
| 2024 | $2,500 | $246,070 | $0 | $0 |
| 2023 | $2,472 | $239,910 | $0 | $0 |
| 2022 | $2,489 | $243,540 | $0 | $0 |
| 2021 | $1,960 | $334,500 | $117,500 | $217,000 |
| 2020 | $1,901 | $304,100 | $106,800 | $197,300 |
| 2019 | $1,790 | $297,800 | $106,800 | $191,000 |
| 2018 | $1,617 | $272,900 | $106,800 | $166,100 |
| 2017 | $1,433 | $132,825 | $0 | $0 |
| 2016 | $1,420 | $122,760 | $0 | $0 |
| 2015 | $1,239 | $108,240 | $0 | $0 |
| 2014 | $1,147 | $104,445 | $0 | $0 |
Source: Public Records
Map
Nearby Homes