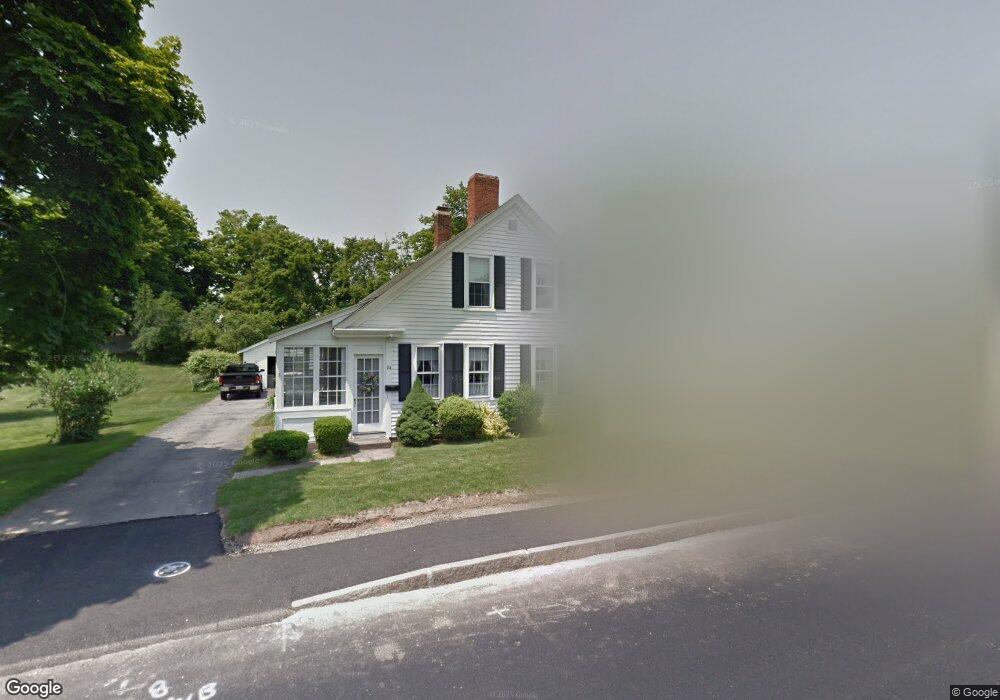
94 North St Unit 2 Randolph, MA 02368
Downtown Randolph NeighborhoodEstimated Value: $504,000 - $712,000
3
Beds
2
Baths
1,000
Sq Ft
$576/Sq Ft
Est. Value
About This Home
This home is located at 94 North St Unit 2, Randolph, MA 02368 and is currently estimated at $576,219, approximately $576 per square foot. 94 North St Unit 2 is a home located in Norfolk County with nearby schools including Randolph High School, Boston Higashi School, and Lighthouse Baptist Christian Academy.
Ownership History
Date
Name
Owned For
Owner Type
Purchase Details
Closed on
Sep 15, 2022
Sold by
Doan Kevin
Bought by
Hang Thuy T
Current Estimated Value
Purchase Details
Closed on
Sep 29, 2021
Sold by
Palmieri David M and Palmieri Denise E
Bought by
Doan Kevin
Purchase Details
Closed on
Jul 1, 2013
Sold by
Walsh Joan E
Bought by
Palmieri David and Palmieri Denise
Home Financials for this Owner
Home Financials are based on the most recent Mortgage that was taken out on this home.
Original Mortgage
$148,000
Interest Rate
3.51%
Mortgage Type
New Conventional
Purchase Details
Closed on
Apr 22, 2013
Sold by
Mcconnell Rt and Mcconnell Helen A
Bought by
Walsh Joan E
Create a Home Valuation Report for This Property
The Home Valuation Report is an in-depth analysis detailing your home's value as well as a comparison with similar homes in the area
Home Values in the Area
Average Home Value in this Area
Purchase History
| Date | Buyer | Sale Price | Title Company |
|---|---|---|---|
| Hang Thuy T | -- | None Available | |
| Doan Kevin | $330,000 | None Available | |
| Palmieri David | $200,000 | -- | |
| Walsh Joan E | -- | -- |
Source: Public Records
Mortgage History
| Date | Status | Borrower | Loan Amount |
|---|---|---|---|
| Previous Owner | Palmieri David | $148,000 |
Source: Public Records
Tax History Compared to Growth
Tax History
| Year | Tax Paid | Tax Assessment Tax Assessment Total Assessment is a certain percentage of the fair market value that is determined by local assessors to be the total taxable value of land and additions on the property. | Land | Improvement |
|---|---|---|---|---|
| 2025 | $5,833 | $502,400 | $239,000 | $263,400 |
| 2024 | $5,726 | $500,100 | $234,400 | $265,700 |
| 2023 | $5,335 | $441,600 | $213,100 | $228,500 |
| 2022 | $5,384 | $395,900 | $177,600 | $218,300 |
| 2021 | $5,120 | $346,400 | $148,000 | $198,400 |
| 2020 | $5,001 | $335,400 | $148,000 | $187,400 |
| 2019 | $4,792 | $319,900 | $141,000 | $178,900 |
| 2018 | $4,419 | $278,300 | $128,200 | $150,100 |
| 2017 | $4,406 | $272,300 | $122,200 | $150,100 |
| 2016 | $4,261 | $245,000 | $111,200 | $133,800 |
| 2015 | $4,089 | $225,900 | $106,000 | $119,900 |
Source: Public Records
Map
Nearby Homes
- 8 Plain St
- 6 Eagle Rd
- 12 Cottage St
- 10 Alfred Terrace
- 21 West St Unit A4
- 217 Mill St
- 229 Mill St
- 41 West St Unit C2
- 19 Cochato Park
- 156 Allen St
- 55 Silver St
- 28 Silver St
- 153 West St
- 35 Linden Park Dr
- 159 Bittersweet Ln Unit 107
- 59 Highland Glen Dr Unit 328
- 23 Nightingale Cir
- 327 Union St
- 469 North St
- 314 South St