Estimated Value: $896,000 - $1,058,000
3
Beds
2
Baths
1,700
Sq Ft
$575/Sq Ft
Est. Value
About This Home
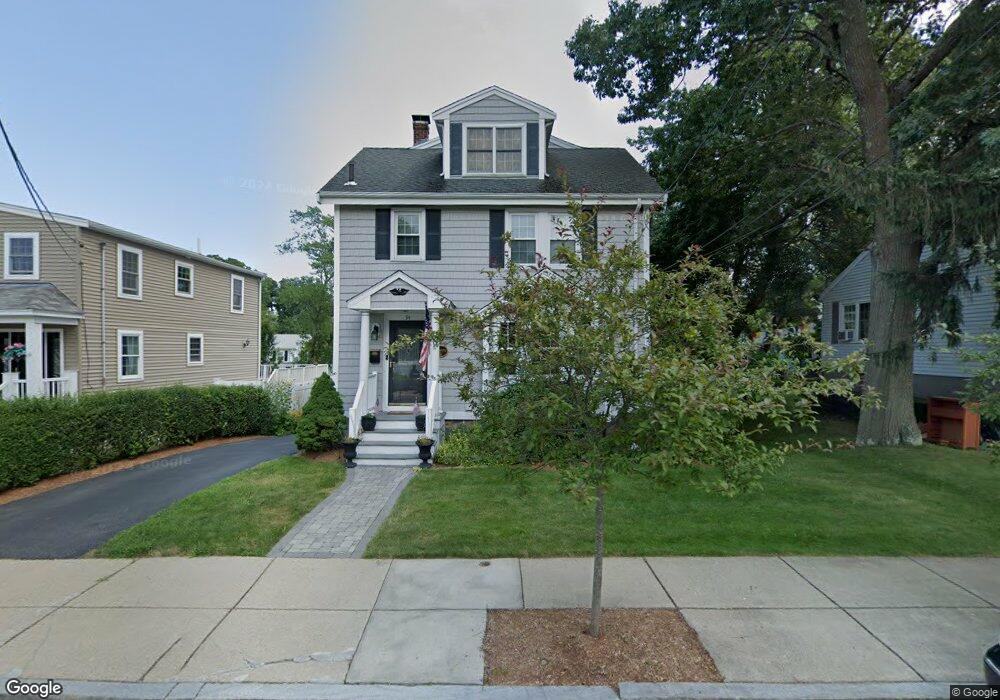
This home is located at 94 Searle Rd, West Roxbury, MA 02132 and is currently estimated at $977,508, approximately $575 per square foot. 94 Searle Rd is a home located in Suffolk County with nearby schools including St Theresa School, The Roxbury Latin School, and Catholic Memorial School.
Ownership History
Date
Name
Owned For
Owner Type
Purchase Details
Closed on
Nov 29, 2004
Sold by
Delahanty Jean L and Delahanty Janet R
Bought by
Corley Robert
Current Estimated Value
Home Financials for this Owner
Home Financials are based on the most recent Mortgage that was taken out on this home.
Original Mortgage
$312,000
Interest Rate
5.75%
Mortgage Type
Purchase Money Mortgage
Create a Home Valuation Report for This Property
The Home Valuation Report is an in-depth analysis detailing your home's value as well as a comparison with similar homes in the area
Home Values in the Area
Average Home Value in this Area
Purchase History
| Date | Buyer | Sale Price | Title Company |
|---|---|---|---|
| Corley Robert | $390,000 | -- |
Source: Public Records
Mortgage History
| Date | Status | Borrower | Loan Amount |
|---|---|---|---|
| Open | Corley Robert | $415,000 | |
| Closed | Corley Robert | $312,000 | |
| Closed | Corley Robert | $58,500 | |
| Previous Owner | Corley Robert | $80,000 |
Source: Public Records
Tax History Compared to Growth
Tax History
| Year | Tax Paid | Tax Assessment Tax Assessment Total Assessment is a certain percentage of the fair market value that is determined by local assessors to be the total taxable value of land and additions on the property. | Land | Improvement |
|---|---|---|---|---|
| 2025 | $9,933 | $857,800 | $216,700 | $641,100 |
| 2024 | $8,546 | $784,000 | $241,500 | $542,500 |
| 2023 | $7,943 | $739,600 | $227,800 | $511,800 |
| 2022 | $7,315 | $672,300 | $207,100 | $465,200 |
| 2021 | $6,836 | $640,700 | $201,100 | $439,600 |
| 2020 | $6,395 | $605,600 | $167,400 | $438,200 |
| 2019 | $5,965 | $565,900 | $139,000 | $426,900 |
| 2018 | $5,646 | $538,700 | $139,000 | $399,700 |
| 2017 | $5,647 | $533,200 | $139,000 | $394,200 |
| 2016 | $5,533 | $503,000 | $139,000 | $364,000 |
| 2015 | $6,107 | $504,300 | $153,500 | $350,800 |
| 2014 | $5,923 | $470,800 | $153,500 | $317,300 |
Source: Public Records
Map
Nearby Homes
- 87 Searle Rd
- 12 Eagle St
- 12 Loyola Cir
- 35 Heron St
- 4873 Washington St Unit 2
- 15 Starling St
- 2 Lagrange St Unit 4
- 2 Lagrange St Unit 7
- 10 Starling St
- 231 Lagrange St
- 4959 Washington St
- 4975 Washington St Unit 311
- 4975 Washington St Unit 305
- 15 White Oak Rd
- 45 Weymouth Ave
- 141 Bellevue St
- 51 Wren St
- 2231 Centre St
- 2290 Centre St
- 35 Wren St