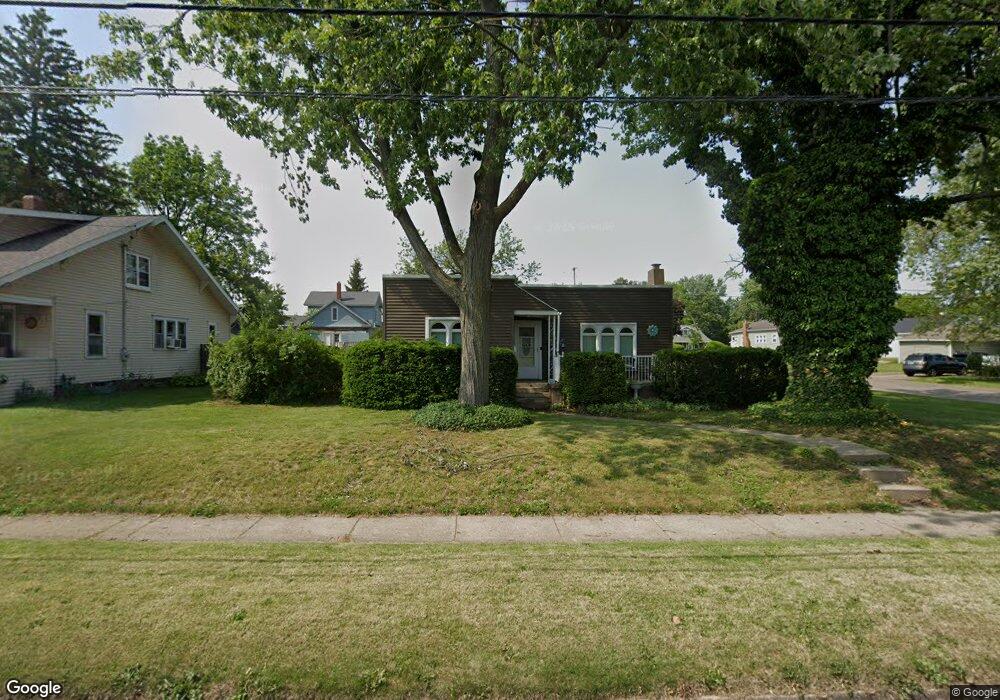
94 Territorial Rd W Battle Creek, MI 49015
Central Battle Creek NeighborhoodEstimated Value: $158,000 - $167,673
3
Beds
2
Baths
1,376
Sq Ft
$118/Sq Ft
Est. Value
About This Home
This home is located at 94 Territorial Rd W, Battle Creek, MI 49015 and is currently estimated at $161,918, approximately $117 per square foot. 94 Territorial Rd W is a home located in Calhoun County with nearby schools including Ann J. Kellogg School, Springfield Middle School, and Battle Creek Central High School.
Ownership History
Date
Name
Owned For
Owner Type
Purchase Details
Closed on
Sep 13, 2022
Sold by
Bouchard Debra
Bought by
Nisevich Tara
Current Estimated Value
Home Financials for this Owner
Home Financials are based on the most recent Mortgage that was taken out on this home.
Original Mortgage
$97,000
Outstanding Balance
$92,650
Interest Rate
5.22%
Mortgage Type
New Conventional
Estimated Equity
$69,268
Purchase Details
Closed on
Jul 27, 2005
Sold by
Gabel Karen A
Bought by
Bouchard Debra
Home Financials for this Owner
Home Financials are based on the most recent Mortgage that was taken out on this home.
Original Mortgage
$71,920
Interest Rate
5.71%
Mortgage Type
Fannie Mae Freddie Mac
Purchase Details
Closed on
Dec 30, 2004
Sold by
Martin Linda L and Poupard Lena L
Bought by
Gabel Karen A
Home Financials for this Owner
Home Financials are based on the most recent Mortgage that was taken out on this home.
Original Mortgage
$81,000
Interest Rate
8.25%
Mortgage Type
Purchase Money Mortgage
Purchase Details
Closed on
Feb 5, 2003
Sold by
Poupard Lena L
Bought by
Poupard Lena L and Poupard Martin,Linda L
Purchase Details
Closed on
Jun 3, 2001
Sold by
Poupard Herman D
Create a Home Valuation Report for This Property
The Home Valuation Report is an in-depth analysis detailing your home's value as well as a comparison with similar homes in the area
Home Values in the Area
Average Home Value in this Area
Purchase History
| Date | Buyer | Sale Price | Title Company |
|---|---|---|---|
| Nisevich Tara | $100,000 | -- | |
| Bouchard Debra | $89,900 | Chicago Title Of Michigan | |
| Gabel Karen A | $90,000 | Chicago Title | |
| Poupard Lena L | -- | -- | |
| -- | -- | -- |
Source: Public Records
Mortgage History
| Date | Status | Borrower | Loan Amount |
|---|---|---|---|
| Open | Nisevich Tara | $97,000 | |
| Closed | Nisevich Tara | $7,970 | |
| Previous Owner | Bouchard Debra | $71,920 | |
| Previous Owner | Gabel Karen A | $81,000 |
Source: Public Records
Tax History Compared to Growth
Tax History
| Year | Tax Paid | Tax Assessment Tax Assessment Total Assessment is a certain percentage of the fair market value that is determined by local assessors to be the total taxable value of land and additions on the property. | Land | Improvement |
|---|---|---|---|---|
| 2025 | -- | $81,200 | $0 | $0 |
| 2024 | $1,346 | $75,453 | $0 | $0 |
| 2023 | $1,538 | $61,762 | $0 | $0 |
| 2022 | $1,215 | $52,716 | $0 | $0 |
| 2021 | $1,451 | $51,279 | $0 | $0 |
| 2020 | $1,344 | $44,004 | $0 | $0 |
| 2019 | $1,272 | $35,073 | $0 | $0 |
| 2018 | $1,272 | $35,272 | $2,234 | $33,038 |
| 2017 | $1,178 | $26,983 | $0 | $0 |
| 2016 | $1,163 | $27,495 | $0 | $0 |
| 2015 | $1,157 | $25,111 | $3,766 | $21,345 |
| 2014 | $1,157 | $25,111 | $3,766 | $21,345 |
Source: Public Records
Map
Nearby Homes
- 235 Fairfield Ave
- 127 W Territorial Rd
- 137 Fairfield Ave
- 184 Territorial Rd W
- 100 Eldred St
- 296 Meachem Ave
- 41 Randolph St
- 32 Territorial Rd E
- 236 Burnham St W
- 547 Wentworth Ave
- 35 Eldred St
- 71 Burnham St W
- 1 Grand Blvd
- 348 Lakeview Ave
- 49 N La Vista Blvd
- 256 Burr St
- 15 Marine Dr
- 251 Columbia Ave W Unit 1
- 349 Goguac St W
- 225 Columbia Ave W Unit 2
- 100 Territorial Rd W
- 104 Territorial Rd W
- 86 Territorial Rd W
- 91 Summer St
- 97 Summer St
- 108 Territorial Rd W
- 84 Territorial Rd W
- 87 Summer St
- 78 Territorial Rd W
- 83 Summer St
- 109 Summer St
- 259 Territorial Rd W
- 81 Summer St
- 90 Summer St
- 94 Summer St
- 96 Summer St
- 100 Summer St
- 113 Summer St
- 74 Territorial Rd W
- 335 Territorial Rd W