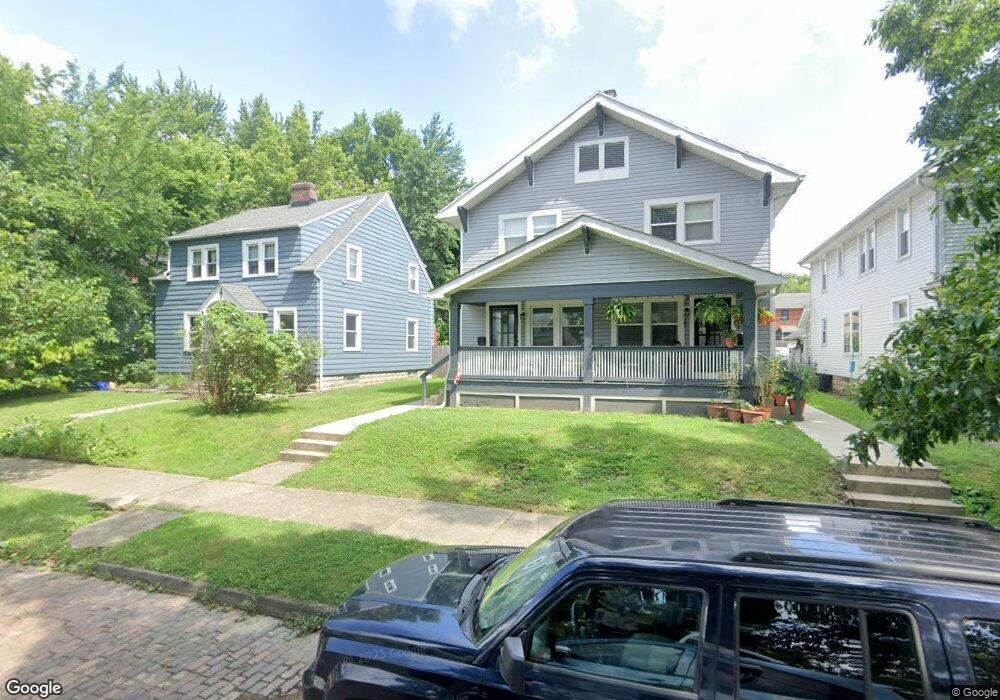
94 W Como Ave Unit 96 Columbus, OH 43202
Clintonville NeighborhoodEstimated Value: $389,000 - $518,000
3
Beds
2
Baths
1,207
Sq Ft
$385/Sq Ft
Est. Value
About This Home
This home is located at 94 W Como Ave Unit 96, Columbus, OH 43202 and is currently estimated at $464,397, approximately $384 per square foot. 94 W Como Ave Unit 96 is a home located in Franklin County with nearby schools including Clinton Elementary School, Dominion Middle School, and Whetstone High School.
Ownership History
Date
Name
Owned For
Owner Type
Purchase Details
Closed on
Oct 28, 2019
Sold by
Brown Ted C
Bought by
Johnston Justin
Current Estimated Value
Home Financials for this Owner
Home Financials are based on the most recent Mortgage that was taken out on this home.
Original Mortgage
$150,330
Outstanding Balance
$132,383
Interest Rate
3.65%
Mortgage Type
New Conventional
Estimated Equity
$332,014
Purchase Details
Closed on
Aug 18, 2010
Sold by
Salem Robert L and Salem Lynn L
Bought by
Brown Ted C
Home Financials for this Owner
Home Financials are based on the most recent Mortgage that was taken out on this home.
Original Mortgage
$193,395
Interest Rate
4.37%
Mortgage Type
FHA
Purchase Details
Closed on
Sep 1, 2004
Sold by
Salem Lynn L
Bought by
Salem Robert L and Salem Lynn L
Purchase Details
Closed on
Sep 10, 1975
Bought by
Salem Robert L
Create a Home Valuation Report for This Property
The Home Valuation Report is an in-depth analysis detailing your home's value as well as a comparison with similar homes in the area
Home Values in the Area
Average Home Value in this Area
Purchase History
| Date | Buyer | Sale Price | Title Company |
|---|---|---|---|
| Johnston Justin | $200,600 | Great American Title | |
| Brown Ted C | $196,000 | Worthington Title Agency Inc | |
| Salem Robert L | -- | -- | |
| Salem Robert L | -- | -- | |
| Salem Robert L | -- | -- |
Source: Public Records
Mortgage History
| Date | Status | Borrower | Loan Amount |
|---|---|---|---|
| Open | Johnston Justin | $150,330 | |
| Previous Owner | Brown Ted C | $193,395 |
Source: Public Records
Tax History Compared to Growth
Tax History
| Year | Tax Paid | Tax Assessment Tax Assessment Total Assessment is a certain percentage of the fair market value that is determined by local assessors to be the total taxable value of land and additions on the property. | Land | Improvement |
|---|---|---|---|---|
| 2024 | $6,413 | $141,410 | $50,790 | $90,620 |
| 2023 | $6,482 | $141,400 | $50,785 | $90,615 |
| 2022 | $5,780 | $107,240 | $32,200 | $75,040 |
| 2021 | $5,524 | $101,820 | $32,200 | $69,620 |
| 2020 | $5,557 | $101,820 | $32,200 | $69,620 |
| 2019 | $4,811 | $78,330 | $24,780 | $53,550 |
| 2018 | $4,555 | $78,330 | $24,780 | $53,550 |
| 2017 | $4,774 | $78,330 | $24,780 | $53,550 |
| 2016 | $4,739 | $70,630 | $22,400 | $48,230 |
| 2015 | $4,308 | $70,630 | $22,400 | $48,230 |
| 2014 | $4,318 | $70,630 | $22,400 | $48,230 |
| 2013 | $2,097 | $69,545 | $21,315 | $48,230 |
Source: Public Records
Map
Nearby Homes
- 117 W Como Ave
- 36 Brighton Rd
- 143 W Pacemont Rd Unit 145
- 187 W Pacemont Rd Unit 189
- 44 W Pacemont Rd
- 88 W Kenworth Rd
- 222 W North Broadway St
- 15 W California Ave
- 35 E Pacemont Rd
- 110 W Tulane Rd
- 63 E Pacemont Rd
- 3066 Dorris Ave Unit 3066
- 155 E North Broadway St
- 10 E Weber Rd Unit 205
- 3021 N High St
- 45 Tibet Rd
- 219 E Como Ave
- 116 Olentangy Point Unit J116
- 168 E Weber Rd
- 180 Tibet Rd
- 94 W Como Ave Unit 94 and 96
- 90 W Como Ave Unit 92
- 100 W Como Ave
- 96 W Como Ave
- 84 W Como Ave Unit 86
- 108 W Como Ave
- 116 W Como Ave
- 85 W Longview Ave
- 91 W Longview Ave
- 79 W Longview Ave Unit 81
- 81 W Longview Ave
- 97 W Longview Ave
- 72 W Como Ave Unit 74
- 97 E Como Ave
- 120 W Como Ave
- 65 W Longview Ave Unit 67
- 105 W Longview Ave
- 66 W Como Ave Unit 68
- 97 W Como Ave
- 101 W Como Ave Unit 103