Estimated Value: $461,000 - $510,000
2
Beds
2
Baths
1,548
Sq Ft
$308/Sq Ft
Est. Value
About This Home
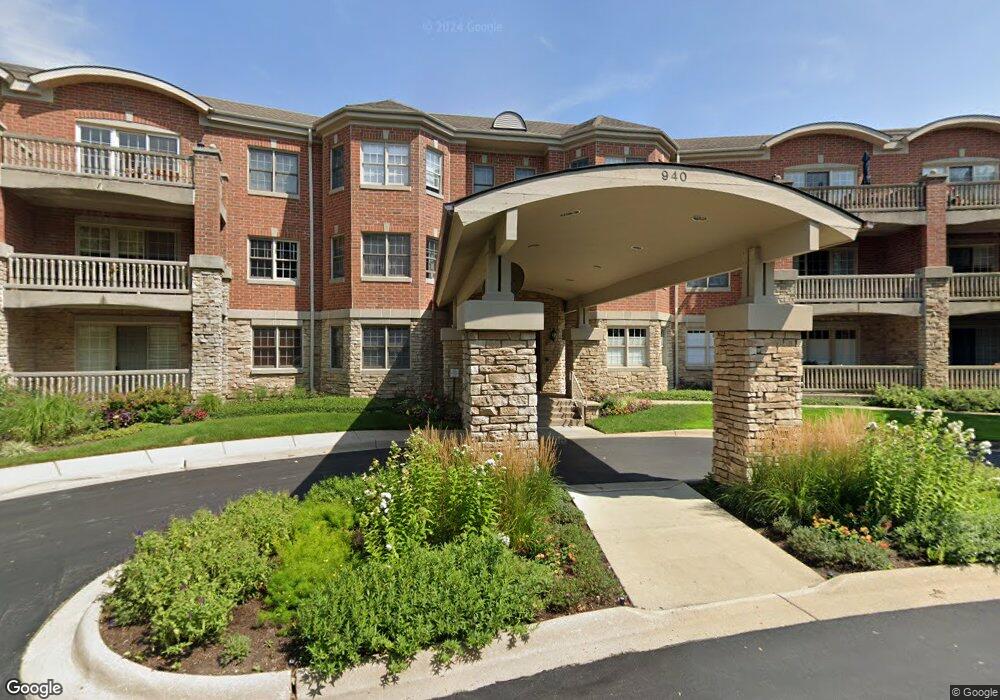
This home is located at 940 Augusta Way Unit 207, Highland Park, IL 60035 and is currently estimated at $476,591, approximately $307 per square foot. 940 Augusta Way Unit 207 is a home located in Lake County with nearby schools including Wayne Thomas Elementary School, Northwood Jr High School, and Highland Park High School.
Ownership History
Date
Name
Owned For
Owner Type
Purchase Details
Closed on
Sep 25, 2017
Sold by
Kall Sally A and Kall Theodore J
Bought by
Waskin Robert and Waskin Wendy
Current Estimated Value
Purchase Details
Closed on
May 8, 2006
Sold by
Cossoff Beverly
Bought by
Sally Ann Kall Revocable Trust
Purchase Details
Closed on
Nov 1, 2000
Sold by
Greenwood Building Corp
Bought by
Cossoff Beverly
Home Financials for this Owner
Home Financials are based on the most recent Mortgage that was taken out on this home.
Original Mortgage
$203,000
Interest Rate
9.25%
Purchase Details
Closed on
Sep 25, 2000
Sold by
Ferris At Highland Park Lp
Bought by
Greenwood Building Corp
Home Financials for this Owner
Home Financials are based on the most recent Mortgage that was taken out on this home.
Original Mortgage
$203,000
Interest Rate
9.25%
Create a Home Valuation Report for This Property
The Home Valuation Report is an in-depth analysis detailing your home's value as well as a comparison with similar homes in the area
Home Values in the Area
Average Home Value in this Area
Purchase History
| Date | Buyer | Sale Price | Title Company |
|---|---|---|---|
| Waskin Robert | $322,000 | Chicago Title | |
| Sally Ann Kall Revocable Trust | $456,000 | None Available | |
| Cossoff Beverly | -- | -- | |
| Greenwood Building Corp | $278,500 | -- |
Source: Public Records
Mortgage History
| Date | Status | Borrower | Loan Amount |
|---|---|---|---|
| Previous Owner | Greenwood Building Corp | $203,000 |
Source: Public Records
Tax History Compared to Growth
Tax History
| Year | Tax Paid | Tax Assessment Tax Assessment Total Assessment is a certain percentage of the fair market value that is determined by local assessors to be the total taxable value of land and additions on the property. | Land | Improvement |
|---|---|---|---|---|
| 2024 | $9,178 | $133,731 | $11,116 | $122,615 |
| 2023 | $9,005 | $120,544 | $10,020 | $110,524 |
| 2022 | $9,005 | $110,924 | $11,092 | $99,832 |
| 2021 | $8,277 | $107,225 | $10,722 | $96,503 |
| 2020 | $8,010 | $107,225 | $10,722 | $96,503 |
| 2019 | $7,746 | $106,724 | $10,672 | $96,052 |
| 2018 | $7,173 | $103,613 | $11,684 | $91,929 |
| 2017 | $7,677 | $103,016 | $11,617 | $91,399 |
| 2016 | $8,256 | $107,838 | $11,060 | $96,778 |
| 2015 | $8,010 | $100,193 | $10,276 | $89,917 |
| 2014 | $6,541 | $85,850 | $10,406 | $75,444 |
| 2012 | $6,372 | $86,351 | $10,467 | $75,884 |
Source: Public Records
About This Building
Map
Nearby Homes
- 940 Augusta Way Unit 309
- 940 Augusta Way Unit 304
- 950 Augusta Way Unit 204
- 2471 Augusta Way
- 2524 Augusta Way
- 0 Wrendale Ave Unit MRD12487576
- 927 Half Day Rd
- 1064 Livingston (Lot 3) Ave
- 1066 Livingston St
- The Astoria Plan at Hidden Oak of Highland Park
- The Essex Plan at Hidden Oak of Highland Park
- The Classic Plan at Hidden Oak of Highland Park
- 1060 Livingston (Lot 5) Ave
- 1062 Livingston St
- 1 Burtis Ave
- 1220 Park Ave W Unit 115
- 2542 Green Bay Rd
- 685 Vine Ave Unit 1
- 2500 Green Bay Rd
- 1250 Park Ave W Unit 435
- 940 Augusta Way Unit 306
- 940 Augusta Way Unit 314
- 940 Augusta Way Unit 313
- 940 Augusta Way Unit 312
- 940 Augusta Way Unit 311
- 940 Augusta Way Unit 310
- 940 Augusta Way Unit 307
- 940 Augusta Way Unit 6C
- 940 Augusta Way Unit 305
- 940 Augusta Way Unit 303
- 940 Augusta Way Unit 302
- 940 Augusta Way Unit 301
- 940 Augusta Way Unit 215
- 940 Augusta Way Unit 213
- 940 Augusta Way Unit 211
- 940 Augusta Way Unit 210
- 940 Augusta Way Unit 209
- 940 Augusta Way Unit 208
- 940 Augusta Way Unit 206
- 940 Augusta Way Unit 205