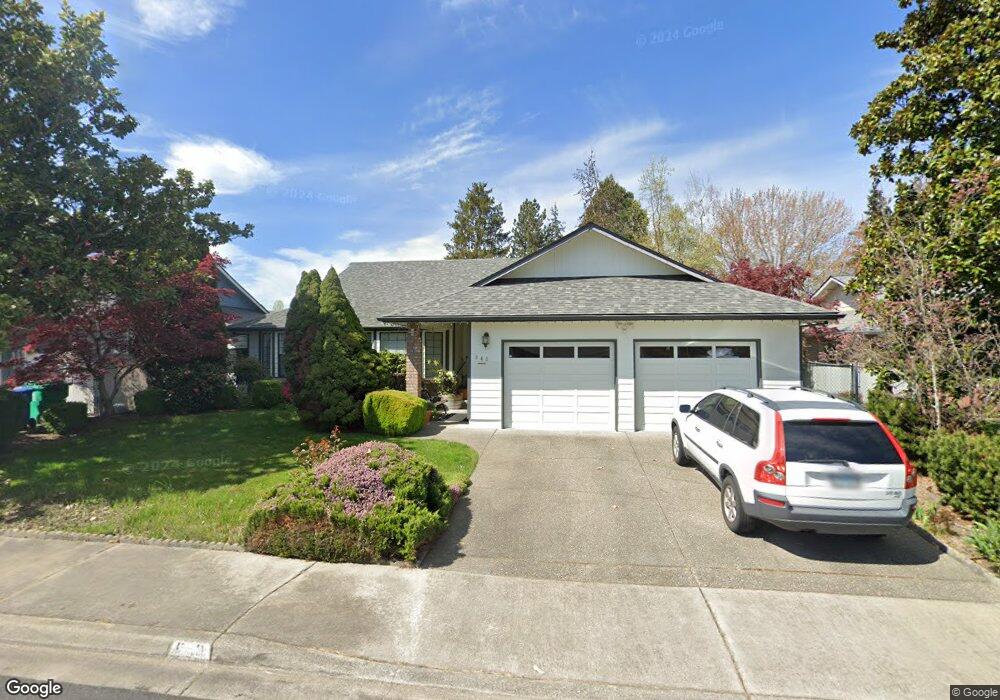
940 Delsie Dr Grants Pass, OR 97527
Estimated Value: $437,188 - $529,000
3
Beds
2
Baths
1,914
Sq Ft
$252/Sq Ft
Est. Value
About This Home
This home is located at 940 Delsie Dr, Grants Pass, OR 97527 and is currently estimated at $483,094, approximately $252 per square foot. 940 Delsie Dr is a home located in Josephine County with nearby schools including Parkside Elementary School, South Middle School, and Grants Pass High School.
Ownership History
Date
Name
Owned For
Owner Type
Purchase Details
Closed on
May 10, 2023
Sold by
Mary Linda Edwards Trust
Bought by
Edwards Mary Linda and Warden Paula Marie
Current Estimated Value
Purchase Details
Closed on
Oct 22, 2021
Sold by
Edwards Mary Linda
Bought by
Mary Linda Edwards Trust and Edwards
Home Financials for this Owner
Home Financials are based on the most recent Mortgage that was taken out on this home.
Original Mortgage
$350,750
Interest Rate
2.8%
Mortgage Type
New Conventional
Purchase Details
Closed on
Jun 3, 2020
Sold by
Edwards Mary
Bought by
Edwards Mary Linda and The Mary Linda Edwards Trust
Purchase Details
Closed on
Feb 4, 2009
Sold by
Edwards Mary Linda
Bought by
Edwards Mary
Home Financials for this Owner
Home Financials are based on the most recent Mortgage that was taken out on this home.
Original Mortgage
$153,000
Interest Rate
5.01%
Mortgage Type
New Conventional
Create a Home Valuation Report for This Property
The Home Valuation Report is an in-depth analysis detailing your home's value as well as a comparison with similar homes in the area
Home Values in the Area
Average Home Value in this Area
Purchase History
| Date | Buyer | Sale Price | Title Company |
|---|---|---|---|
| Edwards Mary Linda | -- | None Listed On Document | |
| Mary Linda Edwards Trust | -- | None Listed On Document | |
| Edwards Mary Linda | -- | None Available | |
| Edwards Mary Linda | -- | None Available | |
| Edwards Mary | -- | Ticor Title |
Source: Public Records
Mortgage History
| Date | Status | Borrower | Loan Amount |
|---|---|---|---|
| Previous Owner | Edwards Mary Linda | $350,750 | |
| Previous Owner | Edwards Mary | $153,000 |
Source: Public Records
Tax History Compared to Growth
Tax History
| Year | Tax Paid | Tax Assessment Tax Assessment Total Assessment is a certain percentage of the fair market value that is determined by local assessors to be the total taxable value of land and additions on the property. | Land | Improvement |
|---|---|---|---|---|
| 2025 | $3,529 | $271,750 | -- | -- |
| 2024 | $3,529 | $263,840 | -- | -- |
| 2023 | $3,324 | $256,160 | $0 | $0 |
| 2022 | $3,239 | $248,700 | $0 | $0 |
| 2021 | $3,137 | $241,460 | $0 | $0 |
| 2020 | $3,046 | $234,430 | $0 | $0 |
| 2019 | $2,958 | $227,610 | $0 | $0 |
| 2018 | $3,010 | $220,990 | $0 | $0 |
| 2017 | $2,988 | $214,560 | $0 | $0 |
| 2016 | $2,627 | $208,320 | $0 | $0 |
| 2015 | $2,541 | $202,260 | $0 | $0 |
| 2014 | $2,471 | $196,370 | $0 | $0 |
Source: Public Records
Map
Nearby Homes
- 1193 Moon Glo Dr
- 776 Delsie Dr
- 1241 Dowell Rd Unit 28
- 1241 Dowell Rd Unit 62
- 111 Briarwood Way
- 112 Briarwood Way
- 2344 Redwood Ave
- 1336 Annabelle Ln
- 2387 Mulberry Ct
- 2372 Sequoia Ct
- 219 Kingsbury Dr
- 206 Kingsbury Dr
- 325 Winston Dr
- 701 Westmont Dr
- 2321 SW Webster Rd
- 208 SW Blueberry Ln
- 313 Winston Dr
- 1471 Dowell Rd
- 2309 SW Webster Rd
- 300 Winston Dr