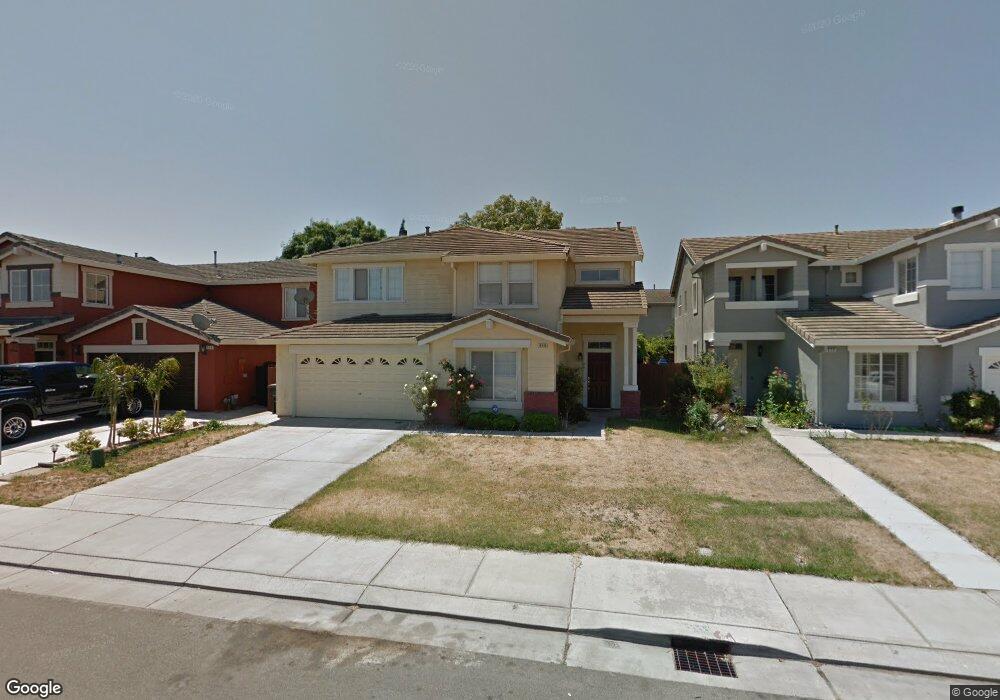
940 Flint Ave Lathrop, CA 95330
East Lathrop NeighborhoodEstimated Value: $578,000 - $661,000
5
Beds
3
Baths
2,763
Sq Ft
$223/Sq Ft
Est. Value
About This Home
This home is located at 940 Flint Ave, Lathrop, CA 95330 and is currently estimated at $615,291, approximately $222 per square foot. 940 Flint Ave is a home located in San Joaquin County with nearby schools including Joseph Widmer, Jr. Elementary School, Lathrop High School, and Central Valley Christian Academy.
Ownership History
Date
Name
Owned For
Owner Type
Purchase Details
Closed on
Aug 18, 2010
Sold by
Grunsky James
Bought by
He Chuanhu and Ding Xiaoyu
Current Estimated Value
Home Financials for this Owner
Home Financials are based on the most recent Mortgage that was taken out on this home.
Original Mortgage
$157,000
Interest Rate
4.51%
Mortgage Type
New Conventional
Purchase Details
Closed on
Feb 11, 2010
Sold by
Halimi Yaqub M and Halimi Naima N
Bought by
Grunsky James
Purchase Details
Closed on
Nov 29, 2000
Sold by
William Lyon Homes Inc
Bought by
Halimi Yaqub M and Halimi Naima N
Home Financials for this Owner
Home Financials are based on the most recent Mortgage that was taken out on this home.
Original Mortgage
$260,800
Interest Rate
7.86%
Mortgage Type
Stand Alone First
Create a Home Valuation Report for This Property
The Home Valuation Report is an in-depth analysis detailing your home's value as well as a comparison with similar homes in the area
Home Values in the Area
Average Home Value in this Area
Purchase History
We collect this data history from publicly available records. To have your information removed, we recommend requesting removal directly through your county’s website.
| Date | Buyer | Sale Price | Title Company |
|---|---|---|---|
| He Chuanhu | $209,500 | Chicago Title Company | |
| Grunsky James | $170,000 | None Available | |
| Halimi Yaqub M | $261,000 | First American Title Co |
Source: Public Records
Mortgage History
We collect this data history from publicly available records. To have your information removed, we recommend requesting removal directly through your county’s website.
| Date | Status | Borrower | Loan Amount |
|---|---|---|---|
| Previous Owner | He Chuanhu | $157,000 | |
| Previous Owner | Halimi Yaqub M | $260,800 | |
| Closed | Halimi Yaqub M | $26,080 |
Source: Public Records
Tax History
| Year | Tax Paid | Tax Assessment Tax Assessment Total Assessment is a certain percentage of the fair market value that is determined by local assessors to be the total taxable value of land and additions on the property. | Land | Improvement |
|---|---|---|---|---|
| 2025 | $4,896 | $268,395 | $66,617 | $201,778 |
| 2024 | $4,750 | $263,133 | $65,311 | $197,822 |
| 2023 | $4,561 | $257,975 | $64,031 | $193,944 |
| 2022 | $4,447 | $252,918 | $62,776 | $190,142 |
| 2021 | $4,341 | $247,960 | $61,546 | $186,414 |
| 2020 | $4,173 | $245,418 | $60,915 | $184,503 |
| 2019 | $4,100 | $240,607 | $59,721 | $180,886 |
| 2018 | $4,013 | $235,890 | $58,550 | $177,340 |
| 2017 | $3,975 | $231,265 | $57,402 | $173,863 |
| 2016 | $3,913 | $226,731 | $56,277 | $170,454 |
| 2014 | $3,736 | $218,952 | $54,346 | $164,606 |
Source: Public Records
Map
Nearby Homes
- 827 Saint Andrew St
- 960 Kirkwood Way
- 13410 Brookwood Way
- 830 Sugar Pine Dr
- 221 Shadywood Ave
- 14310 Cedar Valley Dr
- 13426 Basalt Ct
- 808 Prairie Dunes Dr
- 127 Argillite Ave
- 162 Ravenwood Ct
- 116 Travertine Ave
- 53 Argillite Ave
- 450 Shilling Ave
- 14129 Reverend Maurice Cotton Dr
- 467 Calcite Ave
- 15055 Hollyhock Ct
- 20 Shilling Ave
- 292 W Lathrop Rd
- 379 Valverde Ct
- 953 Thomsen Rd
Your Personal Tour Guide
Ask me questions while you tour the home.