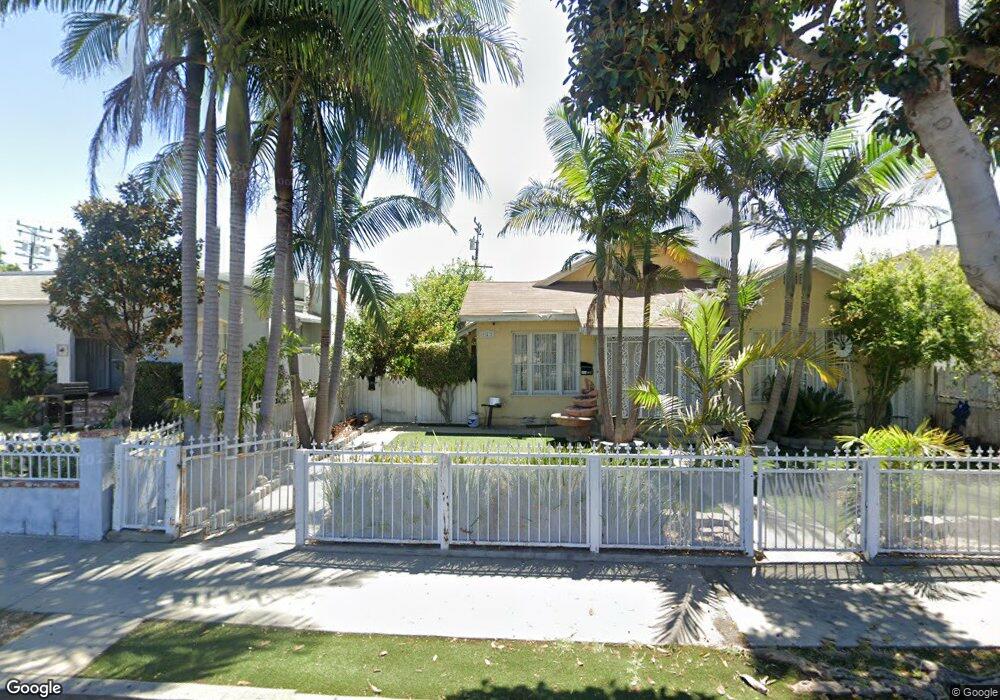
940 Maple St Inglewood, CA 90301
Estimated Value: $804,000 - $962,081
4
Beds
2
Baths
1,676
Sq Ft
$507/Sq Ft
Est. Value
About This Home
This home is located at 940 Maple St, Inglewood, CA 90301 and is currently estimated at $850,020, approximately $507 per square foot. 940 Maple St is a home located in Los Angeles County with nearby schools including Payne (Beulah) Elementary School, Crozier (George W.) Middle School, and Morningside High School.
Ownership History
Date
Name
Owned For
Owner Type
Purchase Details
Closed on
Feb 1, 2006
Sold by
Sevilla Tomas O and Sevilla Guillermina S
Bought by
Camarillo Rodolfo Flores
Current Estimated Value
Home Financials for this Owner
Home Financials are based on the most recent Mortgage that was taken out on this home.
Original Mortgage
$90,000
Interest Rate
6.25%
Mortgage Type
Stand Alone Second
Create a Home Valuation Report for This Property
The Home Valuation Report is an in-depth analysis detailing your home's value as well as a comparison with similar homes in the area
Home Values in the Area
Average Home Value in this Area
Purchase History
| Date | Buyer | Sale Price | Title Company |
|---|---|---|---|
| Camarillo Rodolfo Flores | $450,000 | Commonwealth | |
| Camarillo Rodolfo Flores | -- | Commonwealth |
Source: Public Records
Mortgage History
| Date | Status | Borrower | Loan Amount |
|---|---|---|---|
| Previous Owner | Camarillo Rodolfo Flores | $90,000 | |
| Previous Owner | Camarillo Rodolfo Flores | $360,000 |
Source: Public Records
Tax History Compared to Growth
Tax History
| Year | Tax Paid | Tax Assessment Tax Assessment Total Assessment is a certain percentage of the fair market value that is determined by local assessors to be the total taxable value of land and additions on the property. | Land | Improvement |
|---|---|---|---|---|
| 2025 | $8,053 | $614,946 | $546,628 | $68,318 |
| 2024 | $8,053 | $602,889 | $535,910 | $66,979 |
| 2023 | $7,971 | $591,068 | $525,402 | $65,666 |
| 2022 | $8,118 | $579,479 | $515,100 | $64,379 |
| 2021 | $8,041 | $568,117 | $505,000 | $63,117 |
| 2020 | $7,681 | $562,292 | $499,822 | $62,470 |
| 2019 | $7,555 | $551,268 | $490,022 | $61,246 |
| 2018 | $7,506 | $540,460 | $480,414 | $60,046 |
| 2016 | $7,111 | $519,475 | $461,760 | $57,715 |
| 2015 | $7,049 | $511,673 | $454,824 | $56,849 |
| 2014 | $5,295 | $369,000 | $259,000 | $110,000 |
Source: Public Records
Map
Nearby Homes
- 823 Java Ave Unit 11
- 1035 Myrtle Ave
- 415 E 97th St
- 721 Larch St Unit 11
- 913 S Truro Ave
- 1124 S Truro Ave
- 509 E 97th St
- 400 E Buckthorn St
- 110 E Hillcrest Blvd Unit 115
- 517 E 97th St
- 511 E 99th St
- 218 E Tamarack Ave Unit 5
- 619 Myrtle Ave
- 141 W Hillcrest Blvd Unit 2
- 724 S Flower St
- 614 Myrtle Ave
- 4828 W 93rd St
- 239 W Hillcrest Blvd
- 626 S Inglewood Ave
- 621 S Osage Ave