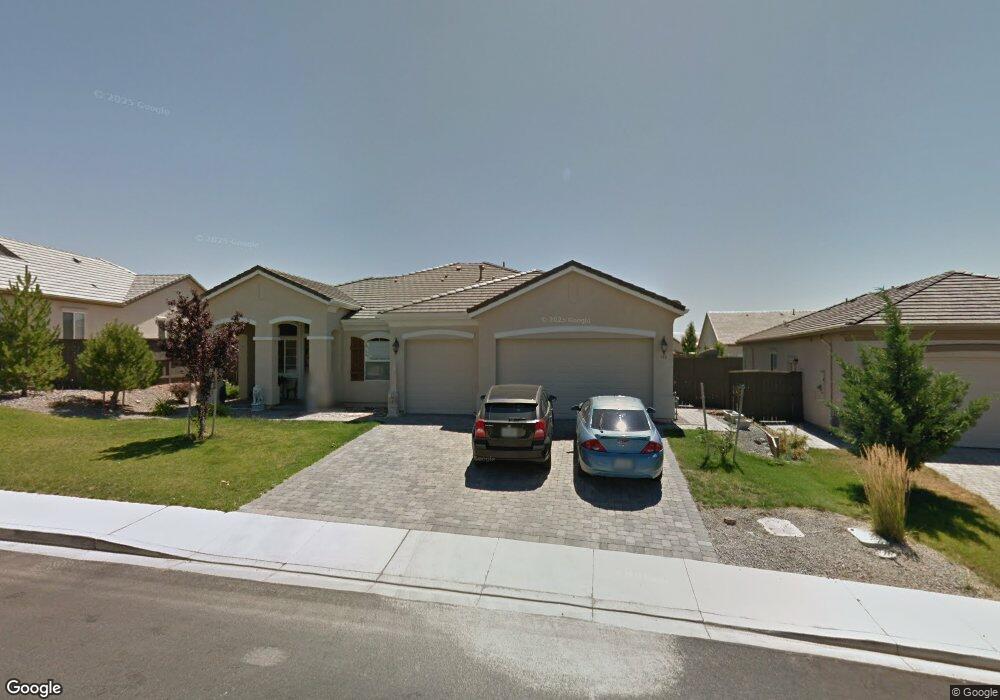
940 N University Park Loop Reno, NV 89512
West University NeighborhoodEstimated Value: $690,525 - $800,000
4
Beds
3
Baths
2,390
Sq Ft
$310/Sq Ft
Est. Value
About This Home
This home is located at 940 N University Park Loop, Reno, NV 89512 and is currently estimated at $741,881, approximately $310 per square foot. 940 N University Park Loop is a home located in Washoe County with nearby schools including Peavine Elementary School, Archie Clayton Pre-AP Academy, and Coral Academy Charter School Elementary.
Ownership History
Date
Name
Owned For
Owner Type
Purchase Details
Closed on
Jun 22, 2016
Sold by
Fuchs Invetments Llc
Bought by
Guzman Humberto and Guzman Lilia
Current Estimated Value
Purchase Details
Closed on
Sep 18, 2008
Sold by
Ramos Elisa P and Ramos Julian T
Bought by
Fuchs Investments Llc
Purchase Details
Closed on
Jul 6, 2006
Sold by
Lennar Reno Llc
Bought by
Ramos Julian T and Ramos Elisa P
Home Financials for this Owner
Home Financials are based on the most recent Mortgage that was taken out on this home.
Original Mortgage
$336,832
Interest Rate
6.63%
Mortgage Type
Stand Alone First
Create a Home Valuation Report for This Property
The Home Valuation Report is an in-depth analysis detailing your home's value as well as a comparison with similar homes in the area
Home Values in the Area
Average Home Value in this Area
Purchase History
| Date | Buyer | Sale Price | Title Company |
|---|---|---|---|
| Guzman Humberto | $385,000 | First Centennial Title | |
| Fuchs Investments Llc | $250,000 | None Available | |
| Ramos Julian T | $449,500 | North American Title Co |
Source: Public Records
Mortgage History
| Date | Status | Borrower | Loan Amount |
|---|---|---|---|
| Previous Owner | Ramos Julian T | $336,832 |
Source: Public Records
Tax History Compared to Growth
Tax History
| Year | Tax Paid | Tax Assessment Tax Assessment Total Assessment is a certain percentage of the fair market value that is determined by local assessors to be the total taxable value of land and additions on the property. | Land | Improvement |
|---|---|---|---|---|
| 2026 | $3,051 | $171,456 | $46,515 | $124,941 |
| 2025 | $3,955 | $173,174 | $46,515 | $126,659 |
| 2024 | $4,027 | $169,954 | $42,525 | $127,429 |
| 2023 | $3,841 | $164,972 | $44,520 | $120,453 |
| 2022 | $3,910 | $140,961 | $40,845 | $100,116 |
| 2021 | $3,621 | $128,351 | $28,980 | $99,371 |
| 2020 | $3,405 | $130,994 | $31,675 | $99,319 |
| 2019 | $3,243 | $126,391 | $30,625 | $95,766 |
| 2018 | $3,095 | $116,751 | $23,450 | $93,301 |
| 2017 | $2,971 | $114,797 | $21,525 | $93,272 |
| 2016 | $2,897 | $115,472 | $20,125 | $95,347 |
| 2015 | $727 | $108,283 | $18,305 | $89,978 |
| 2014 | $2,801 | $92,996 | $15,330 | $77,666 |
| 2013 | -- | $73,444 | $11,410 | $62,034 |
Source: Public Records
Map
Nearby Homes
- 1080 S University Park Loop
- 1120 University Park Ct
- 3715 Coastal St
- 3621 Pimlico St
- 3510 Comstock Dr
- 3656 Ruidoso St
- 3566 Penn National Dr
- 27 Chianti Way
- 29 Chianti Way
- 18 Colombard Way
- 93 Cabernet Pkwy
- 26 S Chardonnay St
- 45 Chablis Dr
- 44 Chablis Dr
- 970 Demos Ct
- 23 Chablis Dr
- 2135 Barberry Way
- 1176 Arrastra Rd Unit Lot 16
- 1172 Arrastra Rd
- 1160 Arrastra Rd
- 930 N University Park Loop
- 950 N University Park Loop
- 3570 Rock Ridge Ct
- 3560 Rock Ridge Ct
- 3580 Rock Ridge Ct
- 960 N University Park Loop
- 945 N University Park Loop
- 935 N University Park Loop
- 925 N University Park Loop
- 955 N University Park Loop
- 3595 Rock Ridge Ct
- 970 N University Park Loop
- 3585 Rock Ridge Ct
- 915 N University Park Loop
- 965 N University Park Loop
- 3545 Rock Ridge Ct
- 3535 Rock Ridge Ct
- 3555 Rock Ridge Ct
- 3660 Sienna Vista Ct
- 3650 Sienna Vista Ct