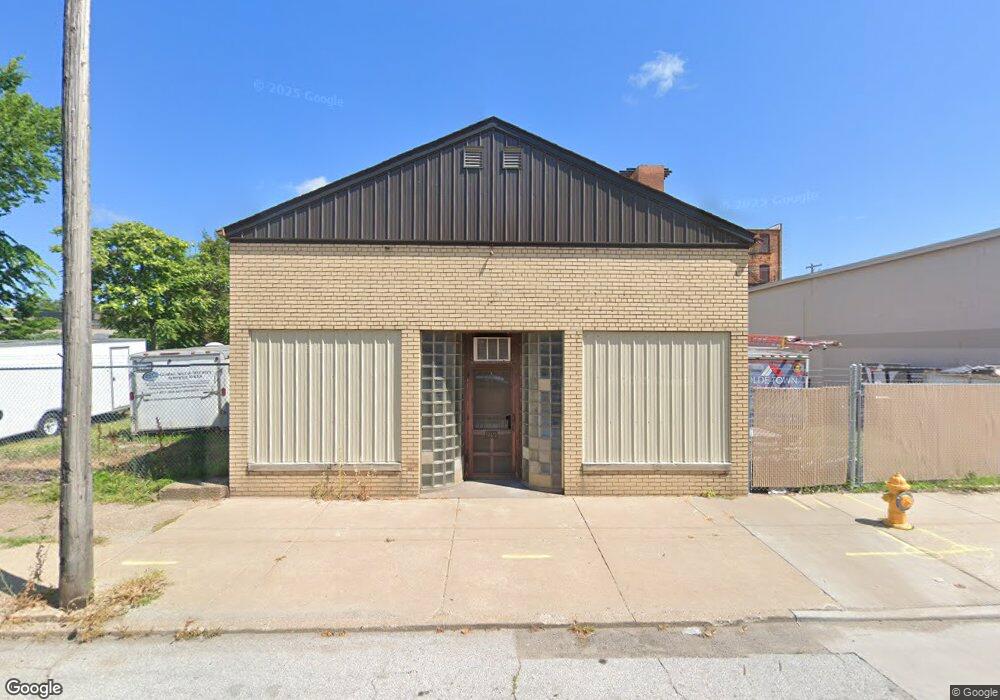
940 W 3rd St Davenport, IA 52802
Downtown Davenport NeighborhoodEstimated Value: $210,919
--
Bed
--
Bath
3,600
Sq Ft
$59/Sq Ft
Est. Value
About This Home
This home is located at 940 W 3rd St, Davenport, IA 52802 and is currently estimated at $210,919, approximately $58 per square foot. 940 W 3rd St is a home located in Scott County with nearby schools including Walnut Hill Elementary School, Christian County Middle School, and Casey County Middle School.
Ownership History
Date
Name
Owned For
Owner Type
Purchase Details
Closed on
Apr 15, 2024
Sold by
Qc Gutter Supply Inc
Bought by
Tmjh Llc
Current Estimated Value
Purchase Details
Closed on
Apr 25, 2023
Sold by
Pph Development Llc
Bought by
Qc Gutter Supply Inc
Purchase Details
Closed on
May 16, 2012
Sold by
C & L Properties Lc
Bought by
Missman Testing & Engineering Llc
Home Financials for this Owner
Home Financials are based on the most recent Mortgage that was taken out on this home.
Original Mortgage
$50,000
Interest Rate
4%
Mortgage Type
Future Advance Clause Open End Mortgage
Create a Home Valuation Report for This Property
The Home Valuation Report is an in-depth analysis detailing your home's value as well as a comparison with similar homes in the area
Home Values in the Area
Average Home Value in this Area
Purchase History
| Date | Buyer | Sale Price | Title Company |
|---|---|---|---|
| Tmjh Llc | $197,500 | None Listed On Document | |
| Qc Gutter Supply Inc | $325,000 | None Listed On Document | |
| Missman Testing & Engineering Llc | $50,000 | None Available |
Source: Public Records
Mortgage History
| Date | Status | Borrower | Loan Amount |
|---|---|---|---|
| Previous Owner | Missman Testing & Engineering Llc | $50,000 | |
| Closed | Tmjh Llc | $0 |
Source: Public Records
Tax History Compared to Growth
Tax History
| Year | Tax Paid | Tax Assessment Tax Assessment Total Assessment is a certain percentage of the fair market value that is determined by local assessors to be the total taxable value of land and additions on the property. | Land | Improvement |
|---|---|---|---|---|
| 2025 | $1,850 | $116,900 | $7,310 | $109,590 |
| 2024 | $3,100 | $103,500 | $7,310 | $96,190 |
| 2023 | $2,360 | $103,500 | $7,310 | $96,190 |
| 2022 | $2,280 | $74,990 | $7,310 | $67,680 |
| 2021 | $2,280 | $74,990 | $7,310 | $67,680 |
| 2020 | $2,256 | $74,990 | $7,310 | $67,680 |
| 2019 | $2,098 | $71,770 | $7,310 | $64,460 |
| 2018 | $2,104 | $71,770 | $7,310 | $64,460 |
| 2017 | $1,502 | $71,770 | $7,310 | $64,460 |
| 2016 | $1,156 | $52,800 | $0 | $0 |
| 2015 | $1,156 | $52,800 | $0 | $0 |
| 2014 | $1,172 | $52,800 | $0 | $0 |
| 2013 | $1,152 | $0 | $0 | $0 |
| 2012 | -- | $52,800 | $11,800 | $41,000 |
Source: Public Records
Map
Nearby Homes