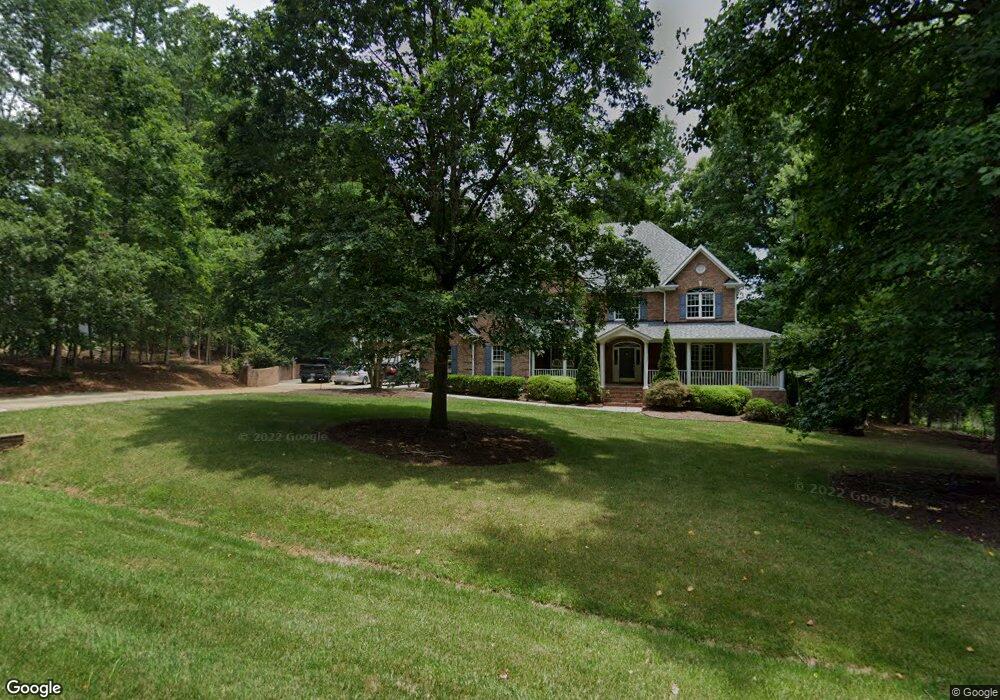
9400 Macon Rd Raleigh, NC 27613
Falls Lake NeighborhoodEstimated Value: $958,000 - $1,134,000
4
Beds
4
Baths
4,106
Sq Ft
$256/Sq Ft
Est. Value
About This Home
This home is located at 9400 Macon Rd, Raleigh, NC 27613 and is currently estimated at $1,050,565, approximately $255 per square foot. 9400 Macon Rd is a home located in Wake County with nearby schools including Leesville Road Middle School, Leesville Road High School, and Quest Academy.
Ownership History
Date
Name
Owned For
Owner Type
Purchase Details
Closed on
Jun 29, 2018
Sold by
Clay Zachary B and Clay Rachael M
Bought by
Brack John and Dart Jennifer
Current Estimated Value
Home Financials for this Owner
Home Financials are based on the most recent Mortgage that was taken out on this home.
Original Mortgage
$555,000
Outstanding Balance
$493,510
Interest Rate
5.75%
Mortgage Type
Adjustable Rate Mortgage/ARM
Estimated Equity
$557,055
Purchase Details
Closed on
Aug 26, 2015
Sold by
Ross Robert D and Ross Carrie A
Bought by
Clay Zachary and Mcweeney Rachel
Home Financials for this Owner
Home Financials are based on the most recent Mortgage that was taken out on this home.
Original Mortgage
$50,100
Interest Rate
4.09%
Mortgage Type
Unknown
Purchase Details
Closed on
Sep 28, 1998
Sold by
Ceres Corp
Bought by
Ross Robert D and Ross Carrie A
Create a Home Valuation Report for This Property
The Home Valuation Report is an in-depth analysis detailing your home's value as well as a comparison with similar homes in the area
Home Values in the Area
Average Home Value in this Area
Purchase History
| Date | Buyer | Sale Price | Title Company |
|---|---|---|---|
| Brack John | $555,000 | None Available | |
| Clay Zachary | $502,000 | Attorney | |
| Ross Robert D | $56,000 | -- |
Source: Public Records
Mortgage History
| Date | Status | Borrower | Loan Amount |
|---|---|---|---|
| Open | Brack John | $555,000 | |
| Closed | Brack John | $250,000 | |
| Previous Owner | Clay Zachary | $50,100 | |
| Previous Owner | Clay Zachary | $401,600 |
Source: Public Records
Tax History Compared to Growth
Tax History
| Year | Tax Paid | Tax Assessment Tax Assessment Total Assessment is a certain percentage of the fair market value that is determined by local assessors to be the total taxable value of land and additions on the property. | Land | Improvement |
|---|---|---|---|---|
| 2025 | $5,904 | $919,917 | $185,000 | $734,917 |
| 2024 | $5,733 | $919,917 | $185,000 | $734,917 |
| 2023 | $4,567 | $583,142 | $132,000 | $451,142 |
| 2022 | $4,231 | $583,142 | $132,000 | $451,142 |
| 2021 | $4,118 | $583,142 | $132,000 | $451,142 |
| 2020 | $4,050 | $583,142 | $132,000 | $451,142 |
| 2019 | $4,121 | $502,083 | $132,000 | $370,083 |
| 2018 | $3,788 | $502,083 | $132,000 | $370,083 |
| 2017 | $3,590 | $502,083 | $132,000 | $370,083 |
| 2016 | $3,517 | $502,083 | $132,000 | $370,083 |
| 2015 | -- | $566,597 | $132,000 | $434,597 |
| 2014 | -- | $566,597 | $132,000 | $434,597 |
Source: Public Records
Map
Nearby Homes
- 5020 Celbridge Place
- 10109 Goodview Ct
- 5009 Wood Valley Dr
- 10729 Winding Wood Trail
- 4820 Sandberry Ln
- 10305 Old Creedmoor Rd
- 10101 Lobley Hill Ln
- 8801 Wildwood Links
- 5204 Barton View Ct
- 5428 Winding View Ln
- 8701 Gleneagles Dr
- 8802 Fidelis Ln
- 8717 Little Deer Ln
- 12909 Baybriar Dr
- 1005 Berwyn Way
- 11804 Mountbatten Way
- 10029 Old Warden Rd
- 9309 Field Maple Ct
- 9305 Field Maple Ct
- 733 Bennington Dr
- 1721 Sonesta Ct
- 1717 Sonesta Ct
- 9409 Macon Rd
- 9417 Macon Rd
- 1713 Sonesta Ct
- 1720 Sonesta Ct
- 1709 Sonesta Ct
- 9421 Macon Rd
- 1712 Sonesta Ct
- 9420 Macon Rd
- 1705 Sonesta Ct
- 9429 Macon Rd
- 9317 Macon Rd
- 1700 Welles Woods Way
- 9321 Macon Rd
- 1701 Sonesta Ct
- 1708 Welles Woods Way
- 1700 Welles Woods Way
- 9428 Macon Rd
- 1700 Sonesta Ct