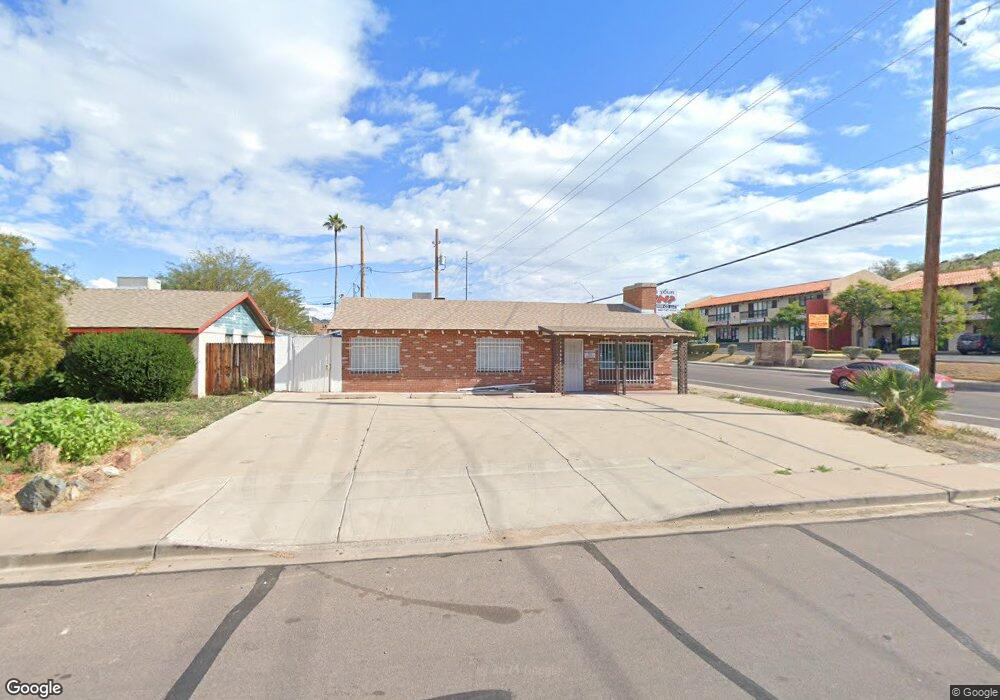
9401 N 3rd Dr Phoenix, AZ 85021
North Central NeighborhoodEstimated Value: $326,000 - $392,000
Studio
--
Bath
2,192
Sq Ft
$161/Sq Ft
Est. Value
About This Home
This home is located at 9401 N 3rd Dr, Phoenix, AZ 85021 and is currently estimated at $352,193, approximately $160 per square foot. 9401 N 3rd Dr is a home located in Maricopa County with nearby schools including Mountain View Elementary School, Sunnyslope High School, and Bennett Academy – Venture Site.
Ownership History
Date
Name
Owned For
Owner Type
Purchase Details
Closed on
Jan 20, 2026
Sold by
Brant Paul and Brant Sonya
Bought by
Mfeo Holdings Llc
Current Estimated Value
Home Financials for this Owner
Home Financials are based on the most recent Mortgage that was taken out on this home.
Original Mortgage
$445,000
Outstanding Balance
$445,000
Interest Rate
6.22%
Mortgage Type
New Conventional
Estimated Equity
-$92,807
Purchase Details
Closed on
Jun 25, 2024
Sold by
Brant Paul
Bought by
Paul & Sonya Brant Trust and Brant
Purchase Details
Closed on
Jul 21, 2004
Sold by
Brant Sonya
Bought by
Brant Paul
Home Financials for this Owner
Home Financials are based on the most recent Mortgage that was taken out on this home.
Original Mortgage
$151,221
Interest Rate
6.24%
Mortgage Type
Commercial
Purchase Details
Closed on
May 21, 2001
Sold by
Scala Edward and Scala Sharyn
Bought by
Johnson Charles A and Ewing Carol J
Home Financials for this Owner
Home Financials are based on the most recent Mortgage that was taken out on this home.
Original Mortgage
$130,000
Interest Rate
7.06%
Mortgage Type
Commercial
Purchase Details
Closed on
Sep 25, 1997
Sold by
Spurlin Joanne
Bought by
Scala Edward and Scala Sharyn
Home Financials for this Owner
Home Financials are based on the most recent Mortgage that was taken out on this home.
Original Mortgage
$90,000
Interest Rate
7.54%
Mortgage Type
Seller Take Back
Create a Home Valuation Report for This Property
The Home Valuation Report is an in-depth analysis detailing your home's value as well as a comparison with similar homes in the area
Home Values in the Area
Average Home Value in this Area
Purchase History
| Date | Buyer | Sale Price | Title Company |
|---|---|---|---|
| Mfeo Holdings Llc | $500,000 | Navi Title Agency | |
| Paul & Sonya Brant Trust | -- | None Listed On Document | |
| Brant Paul | -- | First American Title Ins Co | |
| Brant Paul | $185,000 | First American Title Ins Co | |
| Johnson Charles A | $165,000 | First American Title | |
| Scala Edward | $105,000 | Ati Title Agency |
Source: Public Records
Mortgage History
| Date | Status | Borrower | Loan Amount |
|---|---|---|---|
| Open | Mfeo Holdings Llc | $445,000 | |
| Previous Owner | Brant Paul | $151,221 | |
| Previous Owner | Johnson Charles A | $130,000 | |
| Previous Owner | Scala Edward | $90,000 |
Source: Public Records
Tax History
| Year | Tax Paid | Tax Assessment Tax Assessment Total Assessment is a certain percentage of the fair market value that is determined by local assessors to be the total taxable value of land and additions on the property. | Land | Improvement |
|---|---|---|---|---|
| 2025 | $2,926 | $23,023 | -- | -- |
| 2024 | $2,937 | $22,612 | -- | -- |
| 2023 | $2,937 | $24,412 | $10,846 | $13,566 |
| 2022 | $2,925 | $21,753 | $9,153 | $12,600 |
| 2021 | $3,151 | $22,032 | $9,414 | $12,618 |
| 2020 | $3,182 | $23,076 | $10,584 | $12,492 |
| 2019 | $3,124 | $21,456 | $9,540 | $11,916 |
| 2018 | $3,042 | $20,844 | $8,856 | $11,988 |
| 2017 | $3,027 | $20,646 | $8,514 | $12,132 |
| 2016 | $2,972 | $19,656 | $8,406 | $11,250 |
| 2015 | $2,829 | $17,520 | $8,122 | $9,398 |
Source: Public Records
Map
Nearby Homes
- 312 W Mission Ln Unit 9
- 203 W Mission Ln
- 306 W Camino Vista
- 29 W Mission Ln
- 9520 N Central Ave
- 16 E Hatcher Rd
- 9001 N 7th Ave
- 9425 N 9th Ave
- 9610 N 2nd St
- 9820 N Central Ave Unit 123
- 9820 N Central Ave Unit 102
- 10005 N 1st Dr
- 8915 N Drey Ln
- 9826 N 2nd St
- 226 E Carol Ave
- 740 W Cinnabar Ave
- 10011 N 1st Ave
- 9616 N 11th Ave
- 225 W Alice Ave
- 12 E Foothill Dr
- 9407 N 3rd Dr
- 9411 N 3rd Dr
- 9406 N 3rd Ave
- 9412 N 3rd Ave
- 9406 N 3rd Dr
- 9417 N 3rd Dr
- 9410 N 3rd Dr
- 9416 N 3rd Ave
- 321 W Hatcher Rd
- 9416 N 3rd Dr
- 9422 N 3rd Ave
- 9423 N 3rd Dr
- 336 W Hatcher Rd
- 9401 N 3rd Ave
- 9405 N 4th Ave
- 9405 N 3rd Ave
- 9420 N 3rd Dr
- 9409 N 4th Ave
- 9411 N 3rd Ave
- 9426 N 3rd Ave Unit CHARM
Your Personal Tour Guide
Ask me questions while you tour the home.