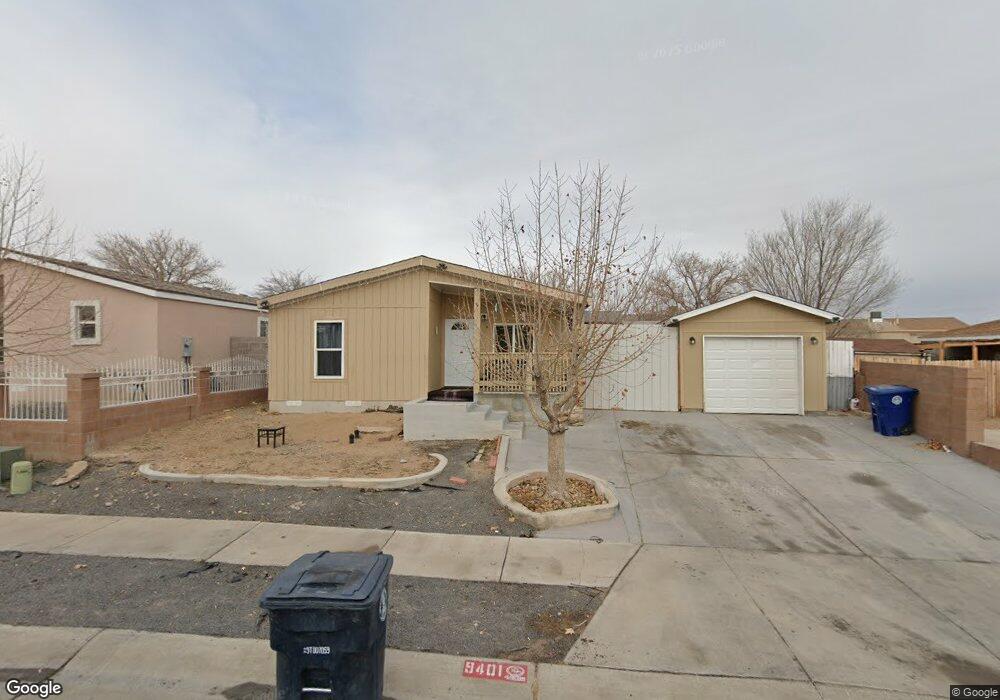
9401 Red Rock Rd SW Albuquerque, NM 87121
Southwest Heights NeighborhoodEstimated Value: $208,000 - $287,000
2
Beds
1
Bath
936
Sq Ft
$268/Sq Ft
Est. Value
About This Home
This home is located at 9401 Red Rock Rd SW, Albuquerque, NM 87121 and is currently estimated at $250,691, approximately $267 per square foot. 9401 Red Rock Rd SW is a home located in Bernalillo County with nearby schools including Maryann Binford Elementary School, Truman Middle School, and Atrisco Heritage Academy High School.
Ownership History
Date
Name
Owned For
Owner Type
Purchase Details
Closed on
Sep 24, 2024
Sold by
Zamarripa Jorge
Bought by
Rivera Lois
Current Estimated Value
Home Financials for this Owner
Home Financials are based on the most recent Mortgage that was taken out on this home.
Original Mortgage
$120,000
Outstanding Balance
$118,651
Interest Rate
6.47%
Mortgage Type
New Conventional
Estimated Equity
$132,040
Purchase Details
Closed on
Mar 13, 2007
Sold by
Copeland Rusty and Copeland Jill
Bought by
Zamarripa Jorge
Home Financials for this Owner
Home Financials are based on the most recent Mortgage that was taken out on this home.
Original Mortgage
$80,733
Interest Rate
6.32%
Mortgage Type
FHA
Purchase Details
Closed on
Oct 17, 2000
Sold by
Capitol Marketing Agency Inc
Bought by
Copeland Rusty
Home Financials for this Owner
Home Financials are based on the most recent Mortgage that was taken out on this home.
Original Mortgage
$79,068
Interest Rate
7.95%
Mortgage Type
FHA
Create a Home Valuation Report for This Property
The Home Valuation Report is an in-depth analysis detailing your home's value as well as a comparison with similar homes in the area
Home Values in the Area
Average Home Value in this Area
Purchase History
| Date | Buyer | Sale Price | Title Company |
|---|---|---|---|
| Rivera Lois | -- | Fidelity National Title | |
| Zamarripa Jorge | -- | Landamerica Albuquerque Titl | |
| Copeland Rusty | -- | Fidelity National Title Ins |
Source: Public Records
Mortgage History
| Date | Status | Borrower | Loan Amount |
|---|---|---|---|
| Open | Rivera Lois | $120,000 | |
| Closed | Rivera Lois | $10,000 | |
| Previous Owner | Zamarripa Jorge | $80,733 | |
| Previous Owner | Copeland Rusty | $79,068 |
Source: Public Records
Tax History Compared to Growth
Tax History
| Year | Tax Paid | Tax Assessment Tax Assessment Total Assessment is a certain percentage of the fair market value that is determined by local assessors to be the total taxable value of land and additions on the property. | Land | Improvement |
|---|---|---|---|---|
| 2025 | $1,170 | $56,528 | $15,032 | $41,496 |
| 2024 | $1,170 | $27,737 | $14,058 | $13,679 |
| 2023 | $1,151 | $26,929 | $13,649 | $13,280 |
| 2022 | $1,112 | $26,146 | $13,252 | $12,894 |
| 2021 | $1,075 | $25,384 | $12,866 | $12,518 |
| 2020 | $1,057 | $24,645 | $12,491 | $12,154 |
| 2019 | $1,026 | $23,927 | $12,127 | $11,800 |
| 2018 | $990 | $23,927 | $12,127 | $11,800 |
| 2017 | $959 | $23,231 | $11,774 | $11,457 |
| 2016 | $932 | $21,898 | $11,099 | $10,799 |
| 2015 | $21,898 | $21,898 | $11,099 | $10,799 |
| 2014 | $936 | $22,031 | $11,099 | $10,932 |
| 2013 | -- | $22,065 | $11,099 | $10,966 |
Source: Public Records
Map
Nearby Homes
- 1327 Amole Vista St SW
- 1209 Locura Rd SW
- 9508 Sage Ranch Ct SW
- 9520 Sage Ranch Ct SW
- 9616 Sage Ranch Ct SW
- 9600 Sage Ranch Ct
- 9300 Jenny Ave SW
- 8600 Kimela Ct SW
- 9504 Sage Ranch Ct
- 9609 Sage Ranch Ct SW
- 9620 Sage Ranch Ct
- 9909 Saddlehorn Trail SW
- 8709 Rhonda Ave SW
- 9901 Morning Sun Trail SW
- 2408 Sun Gate Trail SW
- 2105 Hermosa Creek Dr SW
- 8524 Stony Creek Rd SW
- 9808 Morning Sun Trail SW
- 10427 Sandy Flats Ave SW
- 9736 Westbound Ave SW
- 9405 Red Rock Rd SW
- 9315 Red Rock Rd SW
- 9409 Red Rock Rd SW
- 9309 Red Rock Rd SW
- 1608 Silver Sky Dr SW
- 9408 Camino San Martin SW
- 9400 Camino San Martin SW
- 9412 Camino San Martin SW
- 9308 Red Rock Rd SW
- 9415 Red Rock Rd SW
- 1612 Silver Sky Dr SW
- 9419 Red Rock Rd SW
- 9312 Camino San Martin SW
- 1605 Silver Sky Dr SW
- 9305 Red Rock Rd SW
- 1609 Silver Sky Dr SW
- 9300 Red Rock Rd SW
- 9305 Silver Sky Dr SW
- 9305 Silver Sky Ct SW
- 9308 Camino San Martin SW