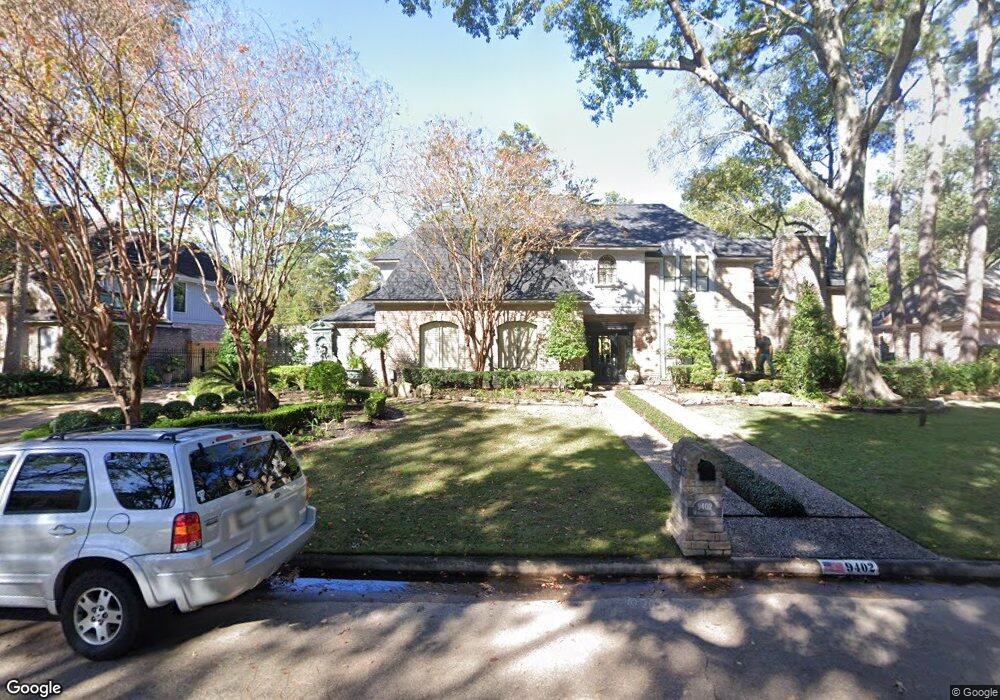
9402 Windrush Dr Spring, TX 77379
Champions NeighborhoodEstimated Value: $613,000 - $656,262
5
Beds
5
Baths
4,275
Sq Ft
$148/Sq Ft
Est. Value
About This Home
This home is located at 9402 Windrush Dr, Spring, TX 77379 and is currently estimated at $633,566, approximately $148 per square foot. 9402 Windrush Dr is a home located in Harris County with nearby schools including Brill Elementary School, Kleb Intermediate School, and Klein High School.
Ownership History
Date
Name
Owned For
Owner Type
Purchase Details
Closed on
Dec 22, 2005
Sold by
Bank Of New York
Bought by
Rodriguez Joey A and Rodriguez Sylvia A
Current Estimated Value
Home Financials for this Owner
Home Financials are based on the most recent Mortgage that was taken out on this home.
Original Mortgage
$257,600
Outstanding Balance
$144,215
Interest Rate
6.3%
Mortgage Type
Fannie Mae Freddie Mac
Estimated Equity
$489,351
Purchase Details
Closed on
Sep 6, 2005
Sold by
Rivas Miguel Angel
Bought by
Mortgage Electronic Registration Systems
Purchase Details
Closed on
Oct 29, 2004
Sold by
Maclean Douglas H and Maclean Maurine S
Bought by
Rivas Miguel Angel
Home Financials for this Owner
Home Financials are based on the most recent Mortgage that was taken out on this home.
Original Mortgage
$336,000
Interest Rate
7.6%
Mortgage Type
New Conventional
Create a Home Valuation Report for This Property
The Home Valuation Report is an in-depth analysis detailing your home's value as well as a comparison with similar homes in the area
Home Values in the Area
Average Home Value in this Area
Purchase History
| Date | Buyer | Sale Price | Title Company |
|---|---|---|---|
| Rodriguez Joey A | -- | None Available | |
| Mortgage Electronic Registration Systems | $357,505 | -- | |
| Rivas Miguel Angel | -- | -- |
Source: Public Records
Mortgage History
| Date | Status | Borrower | Loan Amount |
|---|---|---|---|
| Open | Rodriguez Joey A | $257,600 | |
| Previous Owner | Rivas Miguel Angel | $336,000 | |
| Closed | Rivas Miguel Angel | $84,000 |
Source: Public Records
Tax History
| Year | Tax Paid | Tax Assessment Tax Assessment Total Assessment is a certain percentage of the fair market value that is determined by local assessors to be the total taxable value of land and additions on the property. | Land | Improvement |
|---|---|---|---|---|
| 2025 | $10,375 | $626,303 | $149,916 | $476,387 |
| 2024 | $10,375 | $590,316 | $149,916 | $440,400 |
| 2023 | $10,375 | $605,002 | $149,916 | $455,086 |
| 2022 | $11,107 | $560,806 | $149,916 | $410,890 |
| 2021 | $10,711 | $456,468 | $84,442 | $372,026 |
| 2020 | $10,541 | $444,906 | $84,442 | $360,464 |
| 2019 | $9,933 | $389,759 | $61,190 | $328,569 |
| 2018 | $5,693 | $423,089 | $61,190 | $361,899 |
| 2017 | $10,625 | $423,089 | $61,190 | $361,899 |
| 2016 | $9,659 | $379,862 | $61,190 | $318,672 |
| 2015 | $7,964 | $378,061 | $61,190 | $316,871 |
| 2014 | $7,964 | $337,779 | $61,190 | $276,589 |
Source: Public Records
Map
Nearby Homes
- 9411 Fenchurch Dr
- 9311 Windrush Dr
- 16114 Hexham Dr
- 16118 Hexham Dr
- 9622 Fenchurch Dr
- 9530 Arcade Dr
- 9507 Godstone Ln
- 16011 Stratton Park Dr
- 9306 Stockport Dr
- 16111 Maplehurst Dr
- 9211 Godstone Ln
- 16119 Maplehurst Dr
- 9911 Oxted Ln
- 16123 Chasemore Dr
- 16403 Agusta Ct
- 9318 Appin Falls Dr
- 16022 Stewarts Grove Dr
- 8807 Chelmsford Ln
- 9203 Taidswood Dr
- 16407 Emilia Ct
- 9330 Windrush Dr
- 9419 Fenchurch Dr
- 9423 Fenchurch Dr
- 9403 Windrush Dr
- 9503 Fenchurch Dr
- 9414 Windrush Dr
- 9322 Windrush Dr
- 9327 Windrush Dr
- 9411 Windrush Dr
- 9407 Fenchurch Dr
- 9422 Fenchurch Dr
- 15910 Guinstead Dr
- 9511 Fenchurch Dr
- 9418 Fenchurch Dr
- 9502 Fenchurch Dr
- 9318 Windrush Dr
- 9422 Windrush Dr
- 9406 Fenchurch Dr
- 15910 Brampton Ct
- 9323 Windrush Dr
Your Personal Tour Guide
Ask me questions while you tour the home.