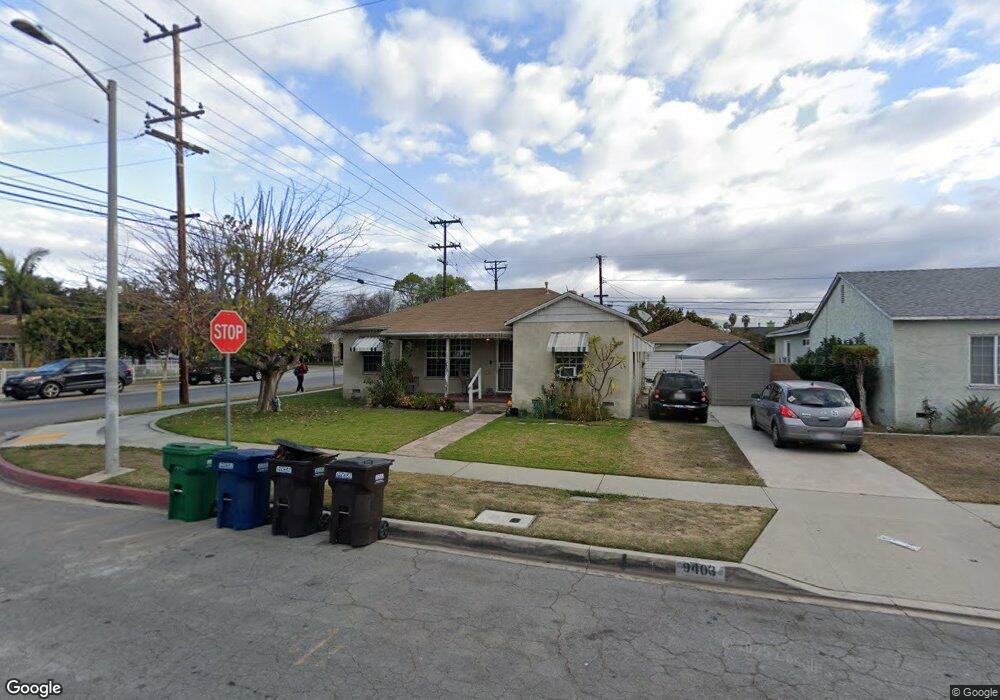
9403 Bert St Pico Rivera, CA 90660
Estimated Value: $696,000 - $730,000
3
Beds
1
Bath
1,098
Sq Ft
$655/Sq Ft
Est. Value
About This Home
This home is located at 9403 Bert St, Pico Rivera, CA 90660 and is currently estimated at $719,093, approximately $654 per square foot. 9403 Bert St is a home located in Los Angeles County with nearby schools including Rivera Elementary School, El Rancho High School, and Ruben Salazar Continuation School.
Ownership History
Date
Name
Owned For
Owner Type
Purchase Details
Closed on
Oct 9, 2007
Sold by
Rivas Patricia A
Bought by
Rivas Patricia and Millan Ramona
Current Estimated Value
Home Financials for this Owner
Home Financials are based on the most recent Mortgage that was taken out on this home.
Original Mortgage
$405,000
Outstanding Balance
$248,249
Interest Rate
5.87%
Mortgage Type
New Conventional
Estimated Equity
$470,844
Purchase Details
Closed on
Jul 15, 2005
Sold by
Millan Ramona
Bought by
Rivas Patricia
Home Financials for this Owner
Home Financials are based on the most recent Mortgage that was taken out on this home.
Original Mortgage
$294,000
Interest Rate
6.66%
Mortgage Type
Purchase Money Mortgage
Create a Home Valuation Report for This Property
The Home Valuation Report is an in-depth analysis detailing your home's value as well as a comparison with similar homes in the area
Home Values in the Area
Average Home Value in this Area
Purchase History
| Date | Buyer | Sale Price | Title Company |
|---|---|---|---|
| Rivas Patricia | -- | Equity Title | |
| Rivas Patricia | -- | First American Title Company |
Source: Public Records
Mortgage History
| Date | Status | Borrower | Loan Amount |
|---|---|---|---|
| Open | Rivas Patricia | $405,000 | |
| Closed | Rivas Patricia | $294,000 |
Source: Public Records
Tax History
| Year | Tax Paid | Tax Assessment Tax Assessment Total Assessment is a certain percentage of the fair market value that is determined by local assessors to be the total taxable value of land and additions on the property. | Land | Improvement |
|---|---|---|---|---|
| 2025 | $5,065 | $340,668 | $263,994 | $76,674 |
| 2024 | $5,065 | $333,989 | $258,818 | $75,171 |
| 2023 | $4,928 | $327,442 | $253,744 | $73,698 |
| 2022 | $4,712 | $321,022 | $248,769 | $72,253 |
| 2021 | $4,596 | $314,729 | $243,892 | $70,837 |
| 2019 | $4,568 | $305,396 | $236,659 | $68,737 |
| 2018 | $4,280 | $299,409 | $232,019 | $67,390 |
| 2016 | $3,869 | $287,784 | $223,010 | $64,774 |
| 2015 | $3,812 | $283,463 | $219,661 | $63,802 |
| 2014 | $3,767 | $277,912 | $215,359 | $62,553 |
Source: Public Records
Map
Nearby Homes
- 9346 Canford St
- 7021 Passons Blvd
- 7019 Passons Blvd
- 7128 Farmland Ave
- 9522 Bascom St
- 9213 Call St
- 9603 Homebrook St
- 7422 Bequette Ave
- 7679 Sunflower Dr
- 7686 Sunflower Dr
- 7705 Sage Dr
- 6651 Via Vista
- 6650 Via Vista
- 6630 Via Vista
- 6648 Via Vista
- 7840 Pioneer Blvd
- 7808 Pioneer Blvd
- 9273 Sierra Vista Cir
- 9243 Balfour St
- 8905 Warvale St
Your Personal Tour Guide
Ask me questions while you tour the home.