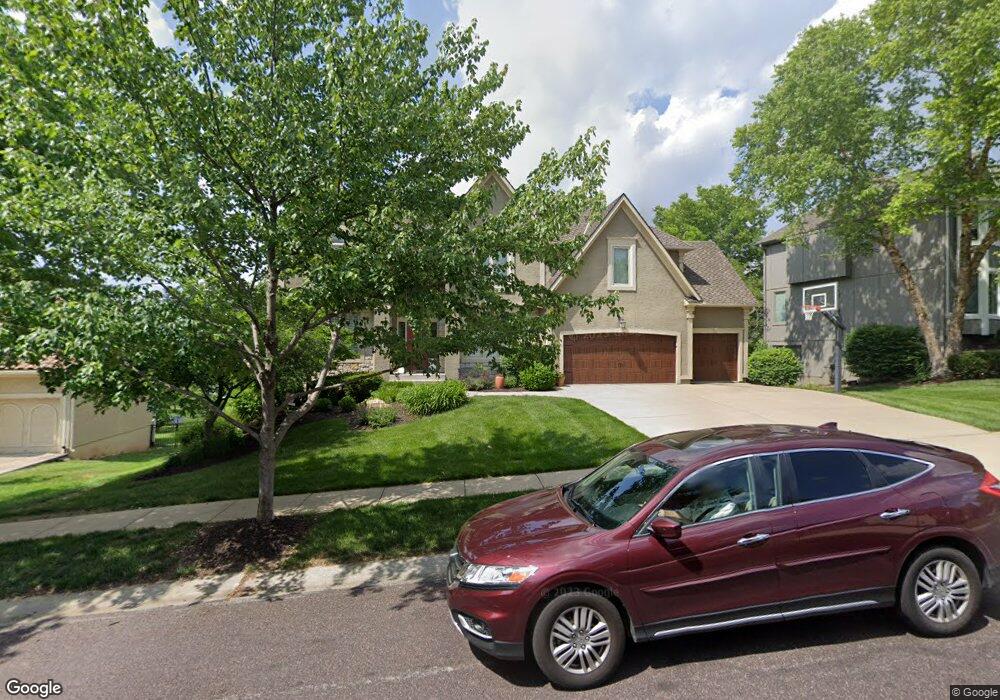
9404 W 145th Terrace Overland Park, KS 66221
South Overland Park NeighborhoodEstimated Value: $710,000 - $773,000
5
Beds
5
Baths
3,257
Sq Ft
$226/Sq Ft
Est. Value
About This Home
This home is located at 9404 W 145th Terrace, Overland Park, KS 66221 and is currently estimated at $735,700, approximately $225 per square foot. 9404 W 145th Terrace is a home located in Johnson County with nearby schools including Sunset Ridge Elementary School, Lakewood Middle School, and Blue Valley West High School.
Ownership History
Date
Name
Owned For
Owner Type
Purchase Details
Closed on
Aug 5, 2020
Sold by
Mcdavid Ben and Mcdavid Kathleen
Bought by
Mcdavid Benjamin Todd and Mcdavid Kathleen Helen
Current Estimated Value
Home Financials for this Owner
Home Financials are based on the most recent Mortgage that was taken out on this home.
Original Mortgage
$263,700
Outstanding Balance
$209,906
Interest Rate
3%
Mortgage Type
New Conventional
Estimated Equity
$525,794
Purchase Details
Closed on
Mar 24, 2020
Sold by
Mcdavid Ben T and Mcdavid Kathleen H
Bought by
Mcdavid Benjamin Todd and Mcdavid Kathleen Helen
Purchase Details
Closed on
Mar 24, 2011
Sold by
Borden Kenneth C and Borden Lori
Bought by
Mcdavid Ben T and Mcdavid Kathleen H
Purchase Details
Closed on
Jan 25, 2005
Sold by
Egly Steven A and Egly Traci D
Bought by
Borden Kenneth C and Borden Lori
Create a Home Valuation Report for This Property
The Home Valuation Report is an in-depth analysis detailing your home's value as well as a comparison with similar homes in the area
Home Values in the Area
Average Home Value in this Area
Purchase History
| Date | Buyer | Sale Price | Title Company |
|---|---|---|---|
| Mcdavid Benjamin Todd | -- | None Available | |
| Mcdavid Ben | -- | None Available | |
| Mcdavid Benjamin Todd | -- | None Available | |
| Mcdavid Ben T | -- | Continental Title Company | |
| Borden Kenneth C | -- | Security Land Title Co |
Source: Public Records
Mortgage History
| Date | Status | Borrower | Loan Amount |
|---|---|---|---|
| Open | Mcdavid Ben | $263,700 |
Source: Public Records
Tax History Compared to Growth
Tax History
| Year | Tax Paid | Tax Assessment Tax Assessment Total Assessment is a certain percentage of the fair market value that is determined by local assessors to be the total taxable value of land and additions on the property. | Land | Improvement |
|---|---|---|---|---|
| 2024 | $7,364 | $71,565 | $14,987 | $56,578 |
| 2023 | $7,107 | $68,092 | $14,987 | $53,105 |
| 2022 | $6,902 | $64,929 | $14,987 | $49,942 |
| 2021 | $6,902 | $59,777 | $13,633 | $46,144 |
| 2020 | $6,668 | $59,248 | $10,902 | $48,346 |
| 2019 | $6,742 | $58,639 | $8,754 | $49,885 |
| 2018 | $6,690 | $57,028 | $8,794 | $48,234 |
| 2017 | $6,378 | $53,406 | $8,794 | $44,612 |
| 2016 | $6,079 | $50,864 | $8,794 | $42,070 |
| 2015 | $6,102 | $50,818 | $8,794 | $42,024 |
| 2013 | -- | $48,449 | $8,794 | $39,655 |
Source: Public Records
Map
Nearby Homes
- 9309 W 144th Terrace
- 9206 W 146th Place
- 14602 Grant Ln
- 14605 Carter St
- 14401 Stearns St
- 9016 W 148th Terrace
- 14808 Carter St
- 14066 Knox St
- 14726 Mackey St
- 14249 Slater St
- 14312 Mackey St
- 9617 W 150th St
- 10675 W 142nd Terrace
- 10612 W 141st St
- 8317 W 144th Place
- 8216 W 146th Terrace
- 10708 W 142nd St
- 8300 W 148th St
- 9519 W 151st Terrace
- 14516 Reeder St
- 9408 W 145th Terrace
- 9400 W 145th Terrace
- 14500 Hayes St
- 9405 W 145th Terrace
- 9500 W 145th Terrace
- 9409 W 145th Terrace
- 14505 Knox St
- 9401 W 145th Terrace
- 14513 Hayes St
- 9504 W 145th Terrace
- 9313 W 145th Terrace
- 14447 Hayes St
- 14501 Knox St
- 9501 W 145th Terrace
- 14529 Grant St
- 14451 Hayes St
- 9322 W 146th St
- 9309 W 145th Terrace
- 9703 W 145th Terrace