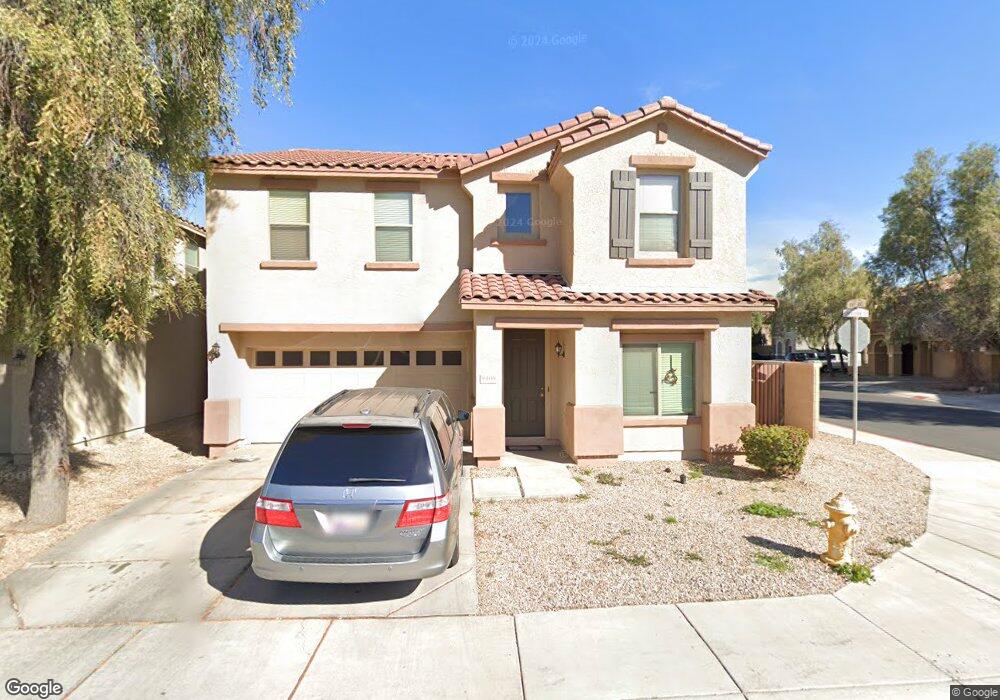
9406 W Sheridan St Phoenix, AZ 85037
Estimated Value: $363,241 - $432,000
--
Bed
3
Baths
2,461
Sq Ft
$162/Sq Ft
Est. Value
About This Home
This home is located at 9406 W Sheridan St, Phoenix, AZ 85037 and is currently estimated at $398,060, approximately $161 per square foot. 9406 W Sheridan St is a home located in Maricopa County with nearby schools including Sheely Farms Elementary School, Tolleson Union High School, and Pan-American Charter School.
Ownership History
Date
Name
Owned For
Owner Type
Purchase Details
Closed on
May 6, 2024
Sold by
Camen Cosmin
Bought by
Camen Cosmin and Camen Sandy
Current Estimated Value
Home Financials for this Owner
Home Financials are based on the most recent Mortgage that was taken out on this home.
Original Mortgage
$141,500
Outstanding Balance
$139,512
Interest Rate
6.87%
Mortgage Type
New Conventional
Estimated Equity
$258,548
Purchase Details
Closed on
Mar 17, 2008
Sold by
Gutman Rodica and Camen Rodica
Bought by
Camen Cosmin
Purchase Details
Closed on
Dec 15, 2004
Sold by
Kb Home Sales Phoenix Inc
Bought by
Camen Rodica
Home Financials for this Owner
Home Financials are based on the most recent Mortgage that was taken out on this home.
Original Mortgage
$212,400
Interest Rate
5.51%
Mortgage Type
New Conventional
Create a Home Valuation Report for This Property
The Home Valuation Report is an in-depth analysis detailing your home's value as well as a comparison with similar homes in the area
Home Values in the Area
Average Home Value in this Area
Purchase History
| Date | Buyer | Sale Price | Title Company |
|---|---|---|---|
| Camen Cosmin | -- | Pioneer Title | |
| Camen Cosmin | -- | The Talon Group Surprise | |
| Camen Rodica | $265,546 | -- | |
| Kb Home Sales Phoenix Inc | -- | First American Title Ins Co |
Source: Public Records
Mortgage History
| Date | Status | Borrower | Loan Amount |
|---|---|---|---|
| Open | Camen Cosmin | $141,500 | |
| Previous Owner | Camen Rodica | $212,400 |
Source: Public Records
Tax History Compared to Growth
Tax History
| Year | Tax Paid | Tax Assessment Tax Assessment Total Assessment is a certain percentage of the fair market value that is determined by local assessors to be the total taxable value of land and additions on the property. | Land | Improvement |
|---|---|---|---|---|
| 2025 | $1,954 | $14,505 | -- | -- |
| 2024 | $1,733 | $13,815 | -- | -- |
| 2023 | $1,733 | $27,880 | $5,570 | $22,310 |
| 2022 | $1,669 | $21,160 | $4,230 | $16,930 |
| 2021 | $1,599 | $20,380 | $4,070 | $16,310 |
| 2020 | $1,555 | $18,720 | $3,740 | $14,980 |
| 2019 | $1,555 | $17,060 | $3,410 | $13,650 |
| 2018 | $1,407 | $16,130 | $3,220 | $12,910 |
| 2017 | $1,257 | $13,700 | $2,740 | $10,960 |
| 2016 | $1,189 | $13,430 | $2,680 | $10,750 |
| 2015 | $1,143 | $12,780 | $2,550 | $10,230 |
Source: Public Records
Map
Nearby Homes
- 2114 N 94th Ave
- 2014 N 93rd Dr
- 2712 N 90th Ln
- 9642 W Verde Ln
- 9646 W Verde Ln
- 2920 N 96th Ln
- 2932 N 96th Ln
- Monterey Plan 3053 at Western Garden - Crest
- Pacifica Plan 3059 at Western Garden - Crest
- Solana Plan 3078 at Western Garden - Crest
- Cambria Plan 3071 at Western Garden - Crest
- Carmel Plan 3050 at Western Garden - Crest
- Ashland Plan 3845 at Western Garden - Gateway
- Avery Plan 4049 at Western Garden - Gateway
- Belmont Plan 4069 at Western Garden - Gateway
- Oxnard Plan 2016 at Western Garden - Reflection
- Lucia Plan 2019 at Western Garden - Reflection
- Windsor Plan 2020 at Western Garden - Reflection
- 8908 W Sheridan St
- 2715 N 90th Ave
- 9410 W Sheridan St
- 9405 W Wilshire Ave
- 9409 W Wilshire Ave
- 9414 W Sheridan St
- 9413 W Wilshire Ave
- 9407 W Sheridan St
- 2221 N 94th Ave
- 9411 W Sheridan St
- 2225 N 94th Ave
- 9418 W Sheridan St
- 9309 W Sheridan St
- 9415 W Sheridan St
- 2229 N 94th Ave
- 9305 W Sheridan St
- 9422 W Sheridan St
- 9408 W Wilshire Ave
- 9421 W Wilshire Ave
- 9412 W Wilshire Ave
- 9404 W Wilshire Ave
- 2233 N 94th Ave