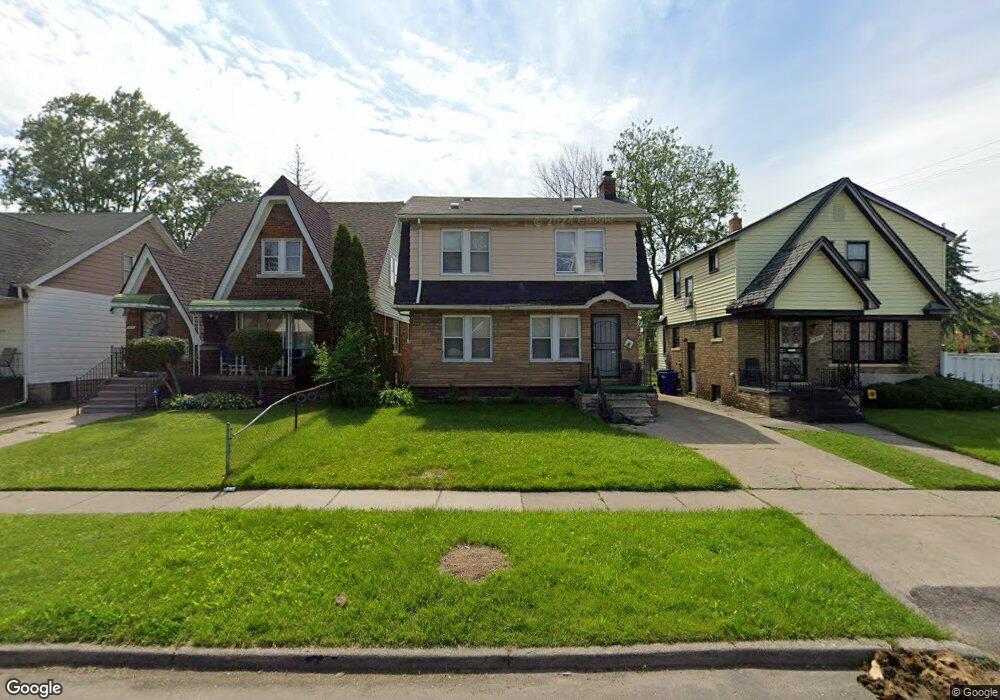
9409 Sorrento St Unit Bldg-Unit Detroit, MI 48228
Barton-McFarland NeighborhoodEstimated Value: $59,000 - $68,122
--
Bed
1
Bath
1,056
Sq Ft
$59/Sq Ft
Est. Value
About This Home
This home is located at 9409 Sorrento St Unit Bldg-Unit, Detroit, MI 48228 and is currently estimated at $62,781, approximately $59 per square foot. 9409 Sorrento St Unit Bldg-Unit is a home located in Wayne County with nearby schools including Bates Academy, Charles L. Spain Elementary-Middle School, and Edward 'Duke' Ellington Conservatory of Music and Art.
Ownership History
Date
Name
Owned For
Owner Type
Purchase Details
Closed on
Mar 6, 2025
Sold by
Motor City Dream Developments Llc
Bought by
Walk By Faith Afh Llc
Current Estimated Value
Purchase Details
Closed on
Dec 13, 2023
Sold by
Detroit Skyline Management Llc
Bought by
Motor City Dream Developments Llc
Purchase Details
Closed on
Aug 7, 2023
Sold by
Oritand Ziv Yahalom Llc
Bought by
Detroit Skyline Management Llc
Purchase Details
Closed on
Jun 25, 2018
Sold by
Glr & Yan Holdings Llc
Bought by
Orit And Ziv Yahalom Llc
Purchase Details
Closed on
May 29, 2014
Sold by
Yaki Llc
Bought by
Megaunion Llc
Purchase Details
Closed on
Jan 29, 2013
Sold by
Metro Detroit Home Solutions Llc
Bought by
Yaki Llc
Purchase Details
Closed on
Jan 18, 2013
Sold by
Thomas Erika
Bought by
Metro Detroit Home Solutions Llc
Create a Home Valuation Report for This Property
The Home Valuation Report is an in-depth analysis detailing your home's value as well as a comparison with similar homes in the area
Home Values in the Area
Average Home Value in this Area
Purchase History
| Date | Buyer | Sale Price | Title Company |
|---|---|---|---|
| Walk By Faith Afh Llc | $59,999 | Independent Title Services | |
| Motor City Dream Developments Llc | $21,000 | None Listed On Document | |
| Detroit Skyline Management Llc | $50,909 | Red Carpet Title | |
| Orit And Ziv Yahalom Llc | $58,000 | Red Carpet Title Agency Llc | |
| Megaunion Llc | -- | None Available | |
| Yaki Llc | -- | None Available | |
| Metro Detroit Home Solutions Llc | -- | None Available |
Source: Public Records
Tax History Compared to Growth
Tax History
| Year | Tax Paid | Tax Assessment Tax Assessment Total Assessment is a certain percentage of the fair market value that is determined by local assessors to be the total taxable value of land and additions on the property. | Land | Improvement |
|---|---|---|---|---|
| 2025 | $2,450 | $35,000 | $0 | $0 |
| 2024 | $2,450 | $29,200 | $0 | $0 |
| 2023 | $1,008 | $22,900 | $0 | $0 |
| 2022 | $1,070 | $16,600 | $0 | $0 |
| 2021 | $1,043 | $12,500 | $0 | $0 |
| 2020 | $1,042 | $11,700 | $0 | $0 |
| 2019 | $1,028 | $8,900 | $0 | $0 |
| 2018 | $676 | $8,100 | $0 | $0 |
| 2017 | $105 | $8,900 | $0 | $0 |
| 2016 | $729 | $6,500 | $0 | $0 |
| 2015 | $650 | $6,500 | $0 | $0 |
| 2013 | $907 | $9,070 | $0 | $0 |
| 2010 | -- | $12,995 | $712 | $12,283 |
Source: Public Records
Map
Nearby Homes
- 9317 Ward St
- 13001 W Chicago
- 9394 Sorrento St
- 9300 Cheyenne St
- 9412 Steel St
- 9231 Sorrento St
- 9241 Steel St
- 9251 Cheyenne St
- 9397 Appoline St
- 9501 Iris St
- 9543 Cheyenne St
- 9534 Littlefield St
- 9244 Littlefield St
- 12800 W Chicago
- 9352 Hartwell St
- 9585 Iris St
- 9566 Littlefield St
- 9371 Hartwell St
- 9385 Hartwell St
- 9242 Appoline St
- 9413 Sorrento St
- 9401 Sorrento St
- 9395 Sorrento St
- 9419 Sorrento St
- 9387 Sorrento St
- 9381 Sorrento St
- 9406 Ward St
- 9400 Ward St
- 9394 Ward St
- 9388 Ward St
- 9373 Sorrento St
- 9406 Sorrento St
- 9400 Sorrento St
- 9414 Sorrento St
- 9382 Ward St
- 9365 Sorrento St
- 9386 Sorrento St
- 12951 W Chicago St
- 9374 Ward St
- 9380 Sorrento St