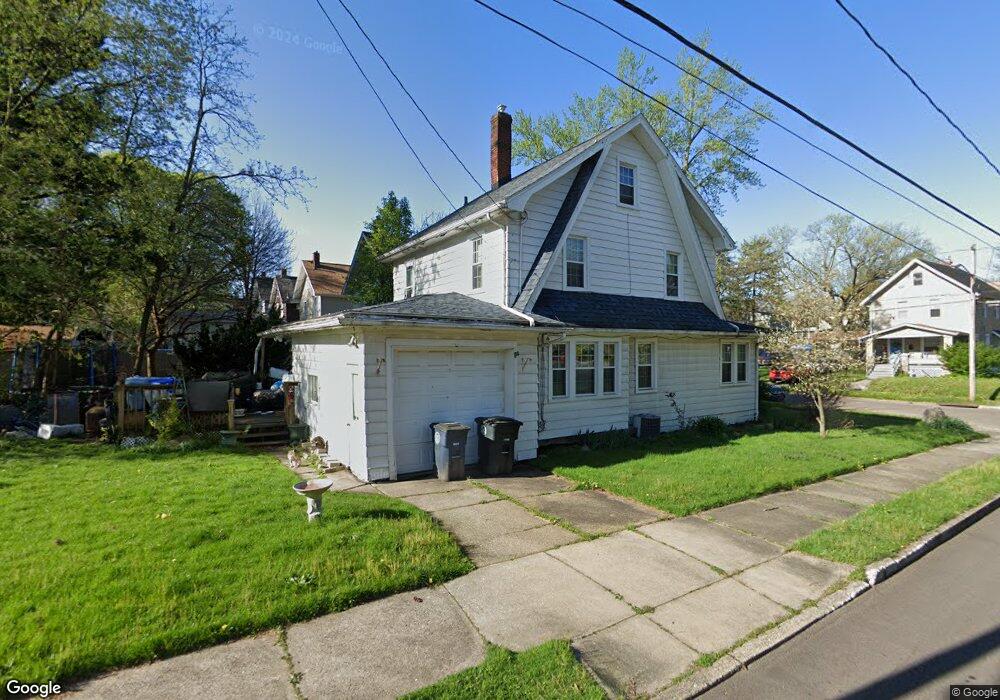
941 Avon St Akron, OH 44310
North Hill NeighborhoodEstimated Value: $112,000 - $144,000
3
Beds
1
Bath
1,414
Sq Ft
$90/Sq Ft
Est. Value
About This Home
This home is located at 941 Avon St, Akron, OH 44310 and is currently estimated at $126,762, approximately $89 per square foot. 941 Avon St is a home located in Summit County with nearby schools including Findley Community Learning Center, North High School, and St. Vincent Elementary School.
Ownership History
Date
Name
Owned For
Owner Type
Purchase Details
Closed on
Oct 3, 2001
Sold by
Heil John J
Bought by
Heil John J and Heil Kathleen M
Current Estimated Value
Purchase Details
Closed on
Jul 13, 2001
Sold by
Fogle Ron
Bought by
Heil John J
Home Financials for this Owner
Home Financials are based on the most recent Mortgage that was taken out on this home.
Original Mortgage
$68,005
Outstanding Balance
$26,455
Interest Rate
7.27%
Mortgage Type
FHA
Estimated Equity
$100,307
Purchase Details
Closed on
Jan 12, 2000
Sold by
Centex Home Equity Corp
Bought by
Fogle Ron
Purchase Details
Closed on
Jul 28, 1999
Sold by
Dawes Brian and Dawes Hilda
Bought by
Centex Home Equity Corp
Purchase Details
Closed on
Dec 7, 1994
Sold by
Mosker Terrance L
Bought by
Dawes Brian and Dawes Hilda
Home Financials for this Owner
Home Financials are based on the most recent Mortgage that was taken out on this home.
Original Mortgage
$35,000
Interest Rate
9.06%
Mortgage Type
New Conventional
Create a Home Valuation Report for This Property
The Home Valuation Report is an in-depth analysis detailing your home's value as well as a comparison with similar homes in the area
Home Values in the Area
Average Home Value in this Area
Purchase History
| Date | Buyer | Sale Price | Title Company |
|---|---|---|---|
| Heil John J | -- | Midland Commerce Group | |
| Heil John J | $78,000 | Midland Commerce Group | |
| Fogle Ron | $36,000 | -- | |
| Centex Home Equity Corp | -- | Tower City Title Agency Inc | |
| Dawes Brian | $35,000 | -- |
Source: Public Records
Mortgage History
| Date | Status | Borrower | Loan Amount |
|---|---|---|---|
| Open | Heil John J | $68,005 | |
| Previous Owner | Dawes Brian | $35,000 |
Source: Public Records
Tax History
| Year | Tax Paid | Tax Assessment Tax Assessment Total Assessment is a certain percentage of the fair market value that is determined by local assessors to be the total taxable value of land and additions on the property. | Land | Improvement |
|---|---|---|---|---|
| 2024 | $1,961 | $33,611 | $6,195 | $27,416 |
| 2023 | $1,961 | $33,611 | $6,195 | $27,416 |
| 2022 | $1,541 | $19,965 | $3,644 | $16,321 |
| 2021 | $1,542 | $19,965 | $3,644 | $16,321 |
| 2020 | $1,479 | $19,960 | $3,640 | $16,320 |
| 2019 | $1,624 | $20,190 | $5,050 | $15,140 |
| 2018 | $1,604 | $20,190 | $5,050 | $15,140 |
| 2017 | $1,671 | $20,190 | $5,050 | $15,140 |
| 2016 | $1,672 | $20,190 | $5,050 | $15,140 |
| 2015 | $1,671 | $20,190 | $5,050 | $15,140 |
| 2014 | $1,659 | $20,190 | $5,050 | $15,140 |
| 2013 | $1,800 | $22,680 | $5,050 | $17,630 |
Source: Public Records
Map
Nearby Homes
- 28 W Salome Ave
- 908 Dayton St
- 1026 Woodward Ave
- 1074 N Main St
- 77 W Mildred Ave
- 1085 Chalker St
- 107 W Dalton St
- 0 E Cuyahoga Falls Ave Unit 5188972
- 775 Wall St
- 748 Chalker St
- 1037 Pitkin Ave
- 1091 Pitkin Ave
- 804 Carpenter St
- 1062 Big Falls Ave
- 1091 Collinwood Ave
- 667 Elma St
- 31 Medford Ave
- 1098 Big Falls Ave
- 1206 Pitkin Ave
- 594 Blaine Ave
Your Personal Tour Guide
Ask me questions while you tour the home.