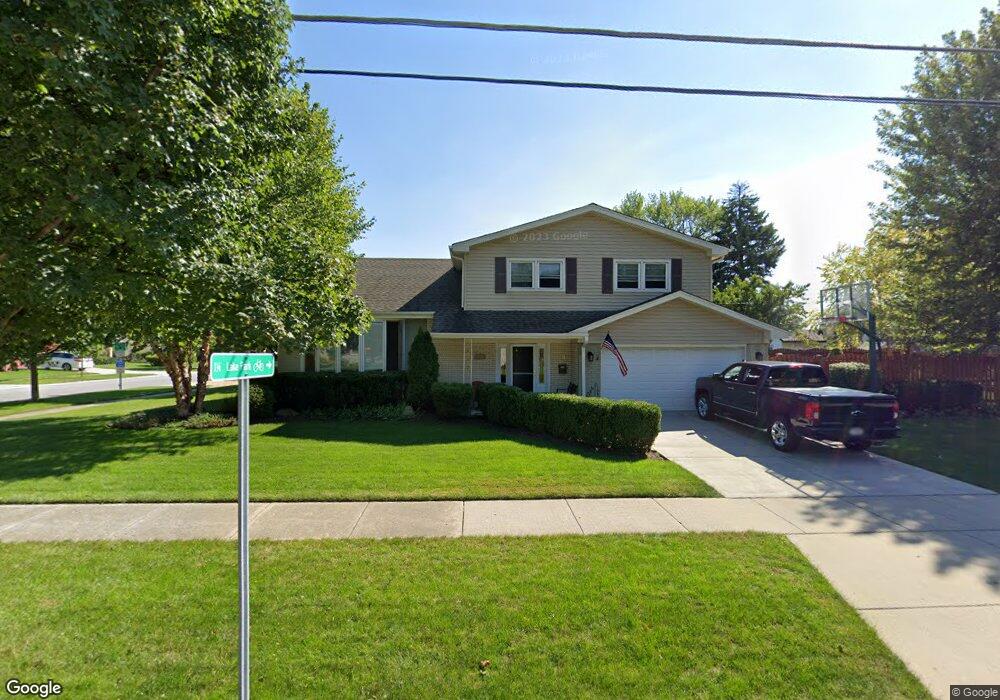
941 E Forest Ave Des Plaines, IL 60018
Estimated Value: $419,000 - $510,000
4
Beds
3
Baths
1,756
Sq Ft
$271/Sq Ft
Est. Value
About This Home
This home is located at 941 E Forest Ave, Des Plaines, IL 60018 and is currently estimated at $475,229, approximately $270 per square foot. 941 E Forest Ave is a home located in Cook County with nearby schools including Forest Elementary School, Algonquin Middle School, and Maine West High School.
Ownership History
Date
Name
Owned For
Owner Type
Purchase Details
Closed on
Oct 17, 2025
Sold by
Weller Mark J and Weller Peggy A
Bought by
Weller Land Trust and Weller
Current Estimated Value
Purchase Details
Closed on
Aug 1, 2025
Sold by
Weller Land Trust and Weller Mark J
Bought by
Weller Mark J and Weller Peggy A
Purchase Details
Closed on
Jan 27, 2023
Sold by
Weller Peggy A and Weller Mark J
Bought by
Weller Land Trust
Purchase Details
Closed on
Apr 14, 2011
Sold by
Weller Mark J
Bought by
Weller Peggy A
Purchase Details
Closed on
Nov 22, 2002
Sold by
Danielson Glen C and Danielson Helen I
Bought by
Weller Mark J and Weller Peggy A
Home Financials for this Owner
Home Financials are based on the most recent Mortgage that was taken out on this home.
Original Mortgage
$232,000
Interest Rate
6.38%
Create a Home Valuation Report for This Property
The Home Valuation Report is an in-depth analysis detailing your home's value as well as a comparison with similar homes in the area
Home Values in the Area
Average Home Value in this Area
Purchase History
| Date | Buyer | Sale Price | Title Company |
|---|---|---|---|
| Weller Land Trust | -- | None Listed On Document | |
| Weller Mark J | -- | None Listed On Document | |
| Weller Land Trust | -- | None Listed On Document | |
| Weller Peggy A | -- | None Available | |
| Weller Mark J | $290,000 | Chicago Title Insurance Co |
Source: Public Records
Mortgage History
| Date | Status | Borrower | Loan Amount |
|---|---|---|---|
| Previous Owner | Weller Mark J | $232,000 | |
| Closed | Weller Mark J | $43,500 |
Source: Public Records
Tax History
| Year | Tax Paid | Tax Assessment Tax Assessment Total Assessment is a certain percentage of the fair market value that is determined by local assessors to be the total taxable value of land and additions on the property. | Land | Improvement |
|---|---|---|---|---|
| 2025 | $8,090 | $45,000 | $10,140 | $34,860 |
| 2024 | $8,090 | $34,000 | $8,450 | $25,550 |
| 2023 | $7,869 | $34,000 | $8,450 | $25,550 |
| 2022 | $7,869 | $34,000 | $8,450 | $25,550 |
| 2021 | $8,443 | $30,799 | $5,492 | $25,307 |
| 2020 | $8,370 | $30,799 | $5,492 | $25,307 |
| 2019 | $8,390 | $34,606 | $5,492 | $29,114 |
| 2018 | $7,700 | $29,181 | $4,858 | $24,323 |
| 2017 | $7,581 | $29,181 | $4,858 | $24,323 |
| 2016 | $7,415 | $29,181 | $4,858 | $24,323 |
| 2015 | $6,748 | $24,946 | $4,225 | $20,721 |
| 2014 | $6,622 | $24,946 | $4,225 | $20,721 |
| 2013 | $7,057 | $27,083 | $4,225 | $22,858 |
Source: Public Records
Map
Nearby Homes
- 1394 Carol Ln
- 1080 Bogart St
- 815 E Oakton St Unit 311
- 664 E Oakton St
- 1162 W Grant Dr
- 674 E Algonquin Rd
- 1205 S Wolf Rd
- 1048 E Walnut Ave
- 505 Forest Ave
- 1122 Alfini Dr
- 980 W Grant Dr
- 1596 Oxford Rd
- 1696 S Elm St
- 1689 S Elm St
- 1645 Illinois St
- 1445 Everett Ave
- 886 E Thacker St
- 1380 Oakwood Ave Unit 306
- 614 Birchwood Ave
- 635 Birchwood Ave
- 1418 Webster Ln
- 937 E Forest Ave
- 1426 Webster Ln
- 933 E Forest Ave
- 1395 Carol Ln
- 1434 Webster Ln
- 934 E Forest Ave
- 951 E Forest Ave
- 1419 Webster Ln
- 942 E Forest Ave
- 929 E Forest Ave
- 1425 Webster Ln
- 1442 Webster Ln
- 1441 Kingston Ct
- 948 E Forest Ave
- 1388 Carol Ln
- 1435 Webster Ln
- 1449 Kingston Ct
- 921 E Forest Ave
- 1450 Webster Ln
Your Personal Tour Guide
Ask me questions while you tour the home.