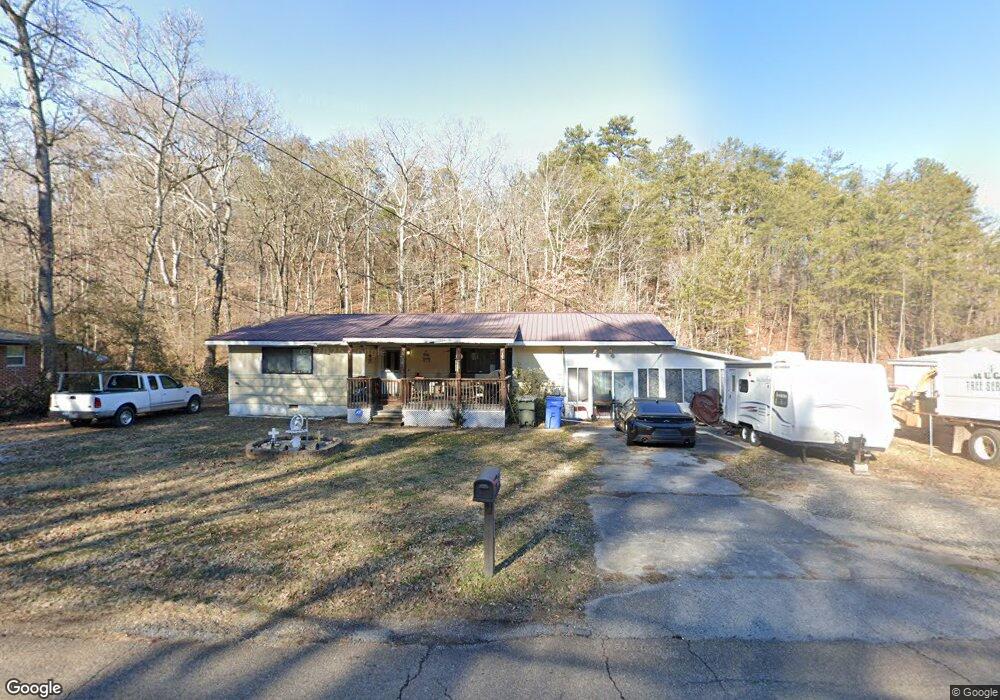
941 Ely Rd Hixson, TN 37343
Lupton City NeighborhoodEstimated Value: $210,000 - $281,000
3
Beds
2
Baths
1,200
Sq Ft
$206/Sq Ft
Est. Value
About This Home
This home is located at 941 Ely Rd, Hixson, TN 37343 and is currently estimated at $247,675, approximately $206 per square foot. 941 Ely Rd is a home located in Hamilton County with nearby schools including Alpine Crest Elementary School, Red Bank Middle School, and Red Bank High School.
Ownership History
Date
Name
Owned For
Owner Type
Purchase Details
Closed on
Jul 7, 2022
Sold by
Eve Farmer Bridget
Bought by
Farmer Bridget E
Current Estimated Value
Purchase Details
Closed on
Mar 9, 2021
Sold by
Farmer Rickey Lee
Bought by
Farmer Rickey Lee and Farmer Bridget Eve
Purchase Details
Closed on
Aug 27, 2020
Sold by
Gouge Trapus
Bought by
Farmer Samuel Lee and Farmer Rickey Lee
Purchase Details
Closed on
Apr 6, 1998
Sold by
Galbraith William L and Galbraith Patricia H
Bought by
Farmer Samuel Lee and Gouge Barbara Ann
Home Financials for this Owner
Home Financials are based on the most recent Mortgage that was taken out on this home.
Original Mortgage
$66,500
Interest Rate
7.06%
Mortgage Type
VA
Purchase Details
Closed on
Oct 2, 1996
Sold by
Collateral Mtg Ltd
Bought by
Hud
Purchase Details
Closed on
Sep 4, 1996
Sold by
Levitt Lloyd A
Bought by
Collateral Mtg Ltd
Create a Home Valuation Report for This Property
The Home Valuation Report is an in-depth analysis detailing your home's value as well as a comparison with similar homes in the area
Home Values in the Area
Average Home Value in this Area
Purchase History
| Date | Buyer | Sale Price | Title Company |
|---|---|---|---|
| Farmer Bridget E | -- | None Listed On Document | |
| Farmer Rickey Lee | -- | Northgate Title Ins | |
| Farmer Samuel Lee | -- | Northgate Title Ins Agcy Inc | |
| Farmer Samuel Lee | $68,500 | -- | |
| Hud | $55,711 | -- | |
| Collateral Mtg Ltd | $55,711 | -- |
Source: Public Records
Mortgage History
| Date | Status | Borrower | Loan Amount |
|---|---|---|---|
| Previous Owner | Farmer Samuel Lee | $66,500 |
Source: Public Records
Tax History
| Year | Tax Paid | Tax Assessment Tax Assessment Total Assessment is a certain percentage of the fair market value that is determined by local assessors to be the total taxable value of land and additions on the property. | Land | Improvement |
|---|---|---|---|---|
| 2025 | $750 | $49,500 | $0 | $0 |
| 2024 | $697 | $31,150 | $0 | $0 |
| 2023 | $697 | $31,150 | $0 | $0 |
| 2022 | $697 | $31,150 | $0 | $0 |
| 2021 | $697 | $31,150 | $0 | $0 |
| 2020 | $707 | $25,550 | $0 | $0 |
| 2019 | $707 | $25,550 | $0 | $0 |
| 2018 | $708 | $25,550 | $0 | $0 |
| 2017 | $707 | $25,550 | $0 | $0 |
| 2016 | $661 | $0 | $0 | $0 |
| 2015 | $1,213 | $23,900 | $0 | $0 |
| 2014 | $1,213 | $0 | $0 | $0 |
Source: Public Records
Map
Nearby Homes
- 936 Sherry Cir
- 1006 Brynewood Terrace
- 4609 Plaza Hills Ln
- 4326 Comet Trail
- 819 Brynwood Dr
- 4529 Sherry Ln
- 802 Ashwood Ln
- 3609 Forest Highland Dr
- 1315 Northgate Cir
- 4539 Sherry Ln
- 961 Ashland Terrace
- 706 Ely Rd
- 1415 Highland Way
- 1416 Highland Way
- 4557 N Ravenwood Dr
- 810 Forest Dale Ln
- 4810 Delashmitt Rd
- 1218 Cranbrook Dr
- 4524 Crestview Dr
- 1313 Michael Ln
Your Personal Tour Guide
Ask me questions while you tour the home.