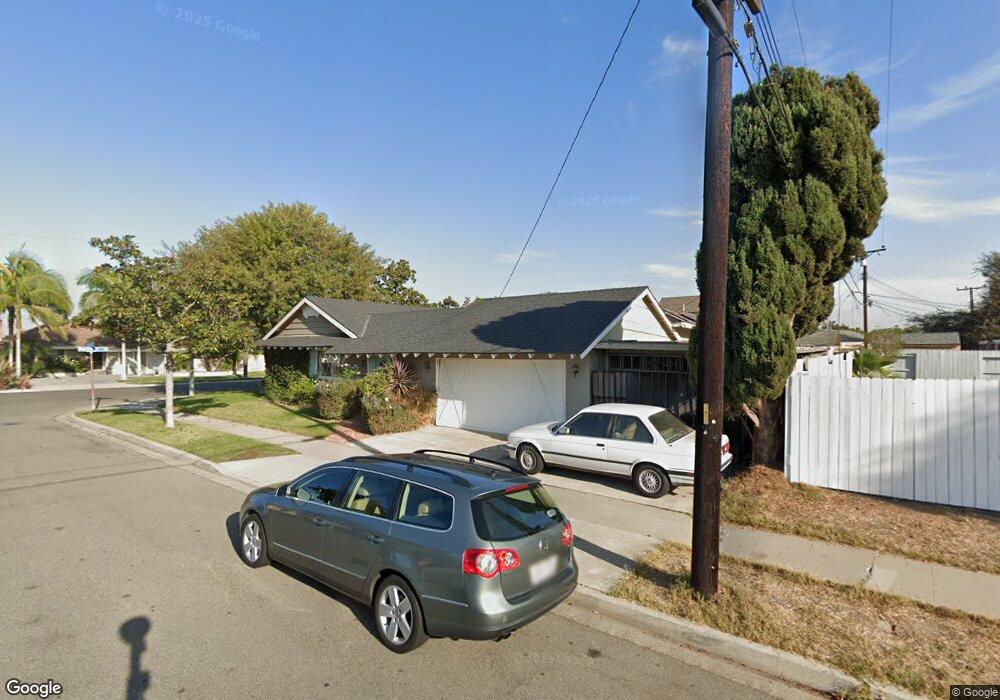
941 Magellan St Costa Mesa, CA 92626
Estimated Value: $653,000 - $1,356,000
3
Beds
2
Baths
1,302
Sq Ft
$839/Sq Ft
Est. Value
About This Home
This home is located at 941 Magellan St, Costa Mesa, CA 92626 and is currently estimated at $1,091,813, approximately $838 per square foot. 941 Magellan St is a home located in Orange County with nearby schools including Sonora Elementary School, Costa Mesa High School, and St. John the Baptist Catholic School.
Ownership History
Date
Name
Owned For
Owner Type
Purchase Details
Closed on
Oct 3, 2023
Sold by
Kroeger Kenneth J and Kroeger Karen Christensen
Bought by
Kroeger Family Trust and Kroeger
Current Estimated Value
Purchase Details
Closed on
Dec 9, 2015
Sold by
The Christensen Family Trust
Bought by
Kroeger Kenneth J and Kroeger Karen Christensen
Home Financials for this Owner
Home Financials are based on the most recent Mortgage that was taken out on this home.
Original Mortgage
$260,000
Interest Rate
3.92%
Mortgage Type
New Conventional
Purchase Details
Closed on
Aug 7, 2015
Sold by
Christensen John A
Bought by
Bednarski Paul J and Christensen Family Trust
Purchase Details
Closed on
May 12, 1995
Sold by
Christensen John E and Christensen Charlotte J
Bought by
Christensen John E and Christensen Charlotte J
Create a Home Valuation Report for This Property
The Home Valuation Report is an in-depth analysis detailing your home's value as well as a comparison with similar homes in the area
Purchase History
| Date | Buyer | Sale Price | Title Company |
|---|---|---|---|
| Kroeger Family Trust | -- | None Listed On Document | |
| Kroeger Kenneth J | $275,000 | First American Title Company | |
| Bednarski Paul J | -- | None Available | |
| Christensen John E | -- | -- |
Source: Public Records
Mortgage History
| Date | Status | Borrower | Loan Amount |
|---|---|---|---|
| Previous Owner | Kroeger Kenneth J | $260,000 |
Source: Public Records
Tax History
| Year | Tax Paid | Tax Assessment Tax Assessment Total Assessment is a certain percentage of the fair market value that is determined by local assessors to be the total taxable value of land and additions on the property. | Land | Improvement |
|---|---|---|---|---|
| 2025 | $4,193 | $308,458 | $183,375 | $125,083 |
| 2024 | $4,193 | $302,410 | $179,779 | $122,631 |
| 2023 | $4,026 | $296,481 | $176,254 | $120,227 |
| 2022 | $3,848 | $290,668 | $172,798 | $117,870 |
| 2021 | $3,711 | $284,969 | $169,410 | $115,559 |
| 2020 | $3,661 | $282,047 | $167,672 | $114,375 |
| 2019 | $3,583 | $276,517 | $164,384 | $112,133 |
| 2018 | $3,512 | $271,096 | $161,161 | $109,935 |
| 2017 | $3,456 | $265,781 | $158,001 | $107,780 |
| 2016 | $3,387 | $260,570 | $154,903 | $105,667 |
| 2015 | $3,354 | $256,656 | $152,576 | $104,080 |
| 2014 | $3,282 | $251,629 | $149,587 | $102,042 |
Source: Public Records
Map
Nearby Homes
- 895 Sonora Rd
- 913 Junipero Dr
- 832 Presidio Dr
- 825 Sonora Rd
- 2836 Portola Dr
- 970 Valencia St
- 1030 Palmetto Way
- 2702 San Lucas Ln
- 944 Tesla Ln
- 1016 Valencia St
- 917 Helena Cir
- 810 Baker St Unit 112
- 781 Grayling Bay
- 783 Grayling
- 3012 Garfield Ave
- 3032 Grant Ave
- 2682 Pala Mesa Ct
- 952 Cheyenne St
- 135 Del Mar Ave
- 2691 Club Mesa Place
- 933 Magellan St
- 946 Junipero Dr
- 942 Junipero Dr
- 949 Magellan St
- 925 Magellan St
- 940 Magellan St
- 934 Magellan St
- 954 Junipero Dr
- 946 Magellan St
- 938 Junipero Dr
- 930 Magellan St
- 951 Magellan St
- 950 Magellan St
- 917 Magellan St
- 956 Junipero Dr
- 945 Junipero Dr
- 901 Sonora Rd
- 941 Junipero Dr
- 934 Junipero Dr
- 915 Sonora Rd
Your Personal Tour Guide
Ask me questions while you tour the home.