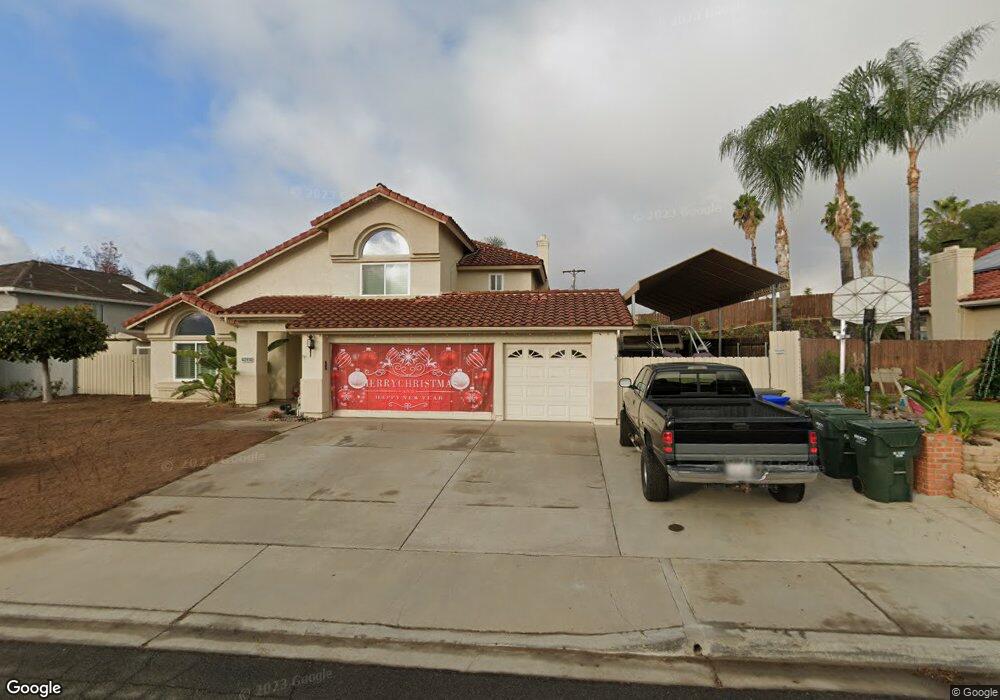
9410 Deanly St Lakeside, CA 92040
Lakeview NeighborhoodEstimated Value: $898,000 - $944,000
3
Beds
3
Baths
2,006
Sq Ft
$460/Sq Ft
Est. Value
About This Home
This home is located at 9410 Deanly St, Lakeside, CA 92040 and is currently estimated at $922,740, approximately $459 per square foot. 9410 Deanly St is a home located in San Diego County with nearby schools including Lakeview Elementary School, Tierra Del Sol Middle School, and El Capitan High School.
Ownership History
Date
Name
Owned For
Owner Type
Purchase Details
Closed on
Dec 7, 2012
Sold by
Jennings Bruce R and Jennings Shana A
Bought by
Jennings Bruce R and Jennings Shana A
Current Estimated Value
Home Financials for this Owner
Home Financials are based on the most recent Mortgage that was taken out on this home.
Original Mortgage
$196,500
Outstanding Balance
$36,110
Interest Rate
3.35%
Mortgage Type
New Conventional
Estimated Equity
$886,630
Purchase Details
Closed on
May 1, 2012
Sold by
Jennings Bruce R and Jennings Shana A
Bought by
Jennings Bruce R and Jennings Shana A
Purchase Details
Closed on
Oct 28, 1993
Sold by
Holmes Frank M
Bought by
Jennings Bruce R and Jennings Shana A
Home Financials for this Owner
Home Financials are based on the most recent Mortgage that was taken out on this home.
Original Mortgage
$184,500
Interest Rate
6.74%
Purchase Details
Closed on
Oct 18, 1993
Sold by
Carmichael Holmes Myrna L
Bought by
Holmes Frank M
Home Financials for this Owner
Home Financials are based on the most recent Mortgage that was taken out on this home.
Original Mortgage
$184,500
Interest Rate
6.74%
Purchase Details
Closed on
Oct 23, 1992
Purchase Details
Closed on
Jun 20, 1989
Create a Home Valuation Report for This Property
The Home Valuation Report is an in-depth analysis detailing your home's value as well as a comparison with similar homes in the area
Home Values in the Area
Average Home Value in this Area
Purchase History
| Date | Buyer | Sale Price | Title Company |
|---|---|---|---|
| Jennings Bruce R | -- | None Available | |
| Jennings Bruce R | -- | Western Resources Title Comp | |
| Jennings Bruce R | -- | None Available | |
| Jennings Bruce R | -- | None Available | |
| Jennings Bruce R | $205,000 | First American Title Co | |
| Holmes Frank M | -- | -- | |
| -- | $215,000 | -- | |
| -- | $215,500 | -- |
Source: Public Records
Mortgage History
| Date | Status | Borrower | Loan Amount |
|---|---|---|---|
| Open | Jennings Bruce R | $196,500 | |
| Closed | Jennings Bruce R | $184,500 |
Source: Public Records
Tax History Compared to Growth
Tax History
| Year | Tax Paid | Tax Assessment Tax Assessment Total Assessment is a certain percentage of the fair market value that is determined by local assessors to be the total taxable value of land and additions on the property. | Land | Improvement |
|---|---|---|---|---|
| 2025 | $5,125 | $382,528 | $124,426 | $258,102 |
| 2024 | $5,125 | $375,029 | $121,987 | $253,042 |
| 2023 | $4,932 | $367,677 | $119,596 | $248,081 |
| 2022 | $4,832 | $360,468 | $117,251 | $243,217 |
| 2021 | $4,770 | $353,401 | $114,952 | $238,449 |
| 2020 | $4,681 | $349,778 | $113,774 | $236,004 |
| 2019 | $4,592 | $342,921 | $111,544 | $231,377 |
| 2018 | $4,492 | $336,198 | $109,357 | $226,841 |
| 2017 | $4,390 | $329,607 | $107,213 | $222,394 |
| 2016 | $4,246 | $323,145 | $105,111 | $218,034 |
| 2015 | $4,218 | $318,292 | $103,533 | $214,759 |
| 2014 | $4,022 | $312,058 | $101,505 | $210,553 |
Source: Public Records
Map
Nearby Homes
- 13872 Jack Oak Ln
- 9500 Harritt Rd Unit SPC 189
- 9500 Harritt Rd
- 9500 Harritt Rd Unit SPC 190
- 9500 Harritt Rd Unit 198
- 9500 Harritt Rd Unit 164
- 9500 Harritt Rd Unit 29
- 13509 E Lakeview Rd
- 13890 Pinkard Way Unit 68
- 13594 Highway 8 Business Unit 48
- 13594 Highway 8 Business Unit 37
- 13594 Highway 8 Business Unit 64
- 14012 Highway 8 Business Unit 9
- 13351 Scotsman Rd
- 13655 Highway 8 Business Unit 96
- 13655 Highway 8 Business Unit 112
- 9395 Harritt Rd Unit SPC 201
- 9395 Harritt Rd Unit SPC 134
- 9395 Harritt Rd Unit 2
- 9395 Harritt Rd
- 9418 Deanly St
- 9402 Deanly St
- 13651 Cuesta Del Sol
- 13649 Cuesta Del Sol
- 9405 Deanly St
- 9409 Deanly St
- 9426 Deanly St
- 13801 Deanly Way
- 9423 Deanly St
- 13809 Deanly Way
- 13692 Vecinio Del Este Place
- 13729 Cuesta Del Sol
- 13688 Vecinio Del Este Place
- 13817 Deanly Way
- 13653 Cuesta Del Sol
- 9427 Deanly St
- 13852 Deanly Way
- 13858 Deanly Way
- 13647 Cuesta Del Sol
- 13866 Deanly Way