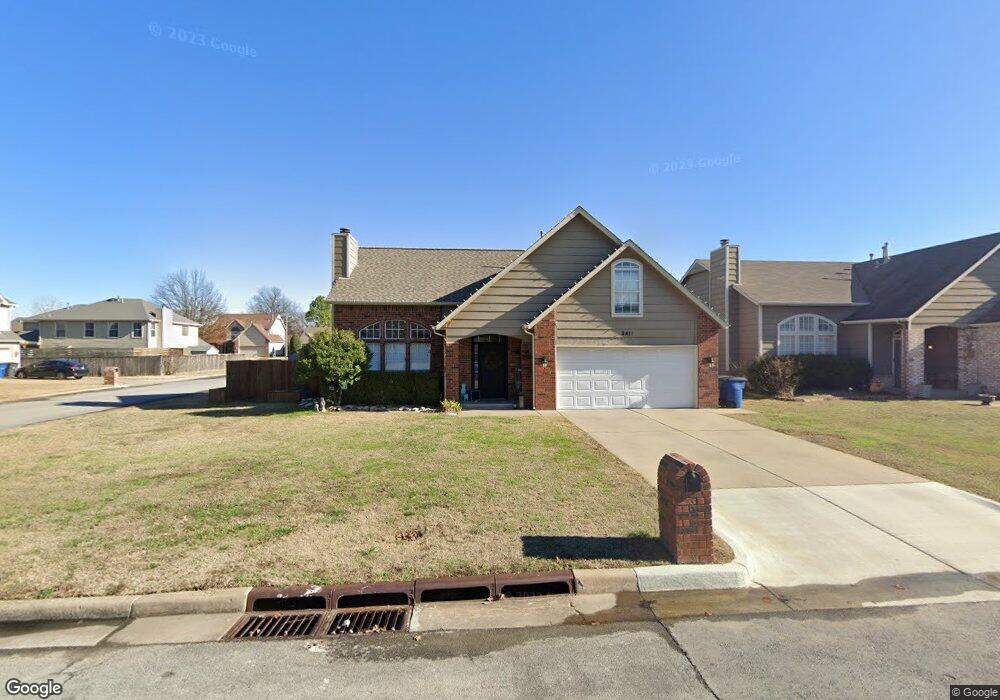
9411 S 88th Ave E Tulsa, OK 74133
Ridge Pointe NeighborhoodEstimated Value: $279,000 - $297,441
Studio
3
Baths
2,053
Sq Ft
$139/Sq Ft
Est. Value
About This Home
This home is located at 9411 S 88th Ave E, Tulsa, OK 74133 and is currently estimated at $286,360, approximately $139 per square foot. 9411 S 88th Ave E is a home located in Tulsa County with nearby schools including Jenks East Elementary School, Jenks East Intermediate Elementary School, and Jenks Middle School.
Ownership History
Date
Name
Owned For
Owner Type
Purchase Details
Closed on
Oct 13, 2024
Sold by
Trivium Homes Llc
Bought by
Trivium Homes Llc-9411 S 88Th East Ave Protec
Current Estimated Value
Purchase Details
Closed on
Jun 3, 2024
Sold by
Hulsey Richard B and Hulsey Amber
Bought by
Trivium Homes Llc
Purchase Details
Closed on
Nov 17, 2014
Sold by
Clark Christopher J and Clark Melissa L
Bought by
Hulsey Richard B and Hulsey Ambery
Home Financials for this Owner
Home Financials are based on the most recent Mortgage that was taken out on this home.
Original Mortgage
$123,560
Interest Rate
3.93%
Mortgage Type
Future Advance Clause Open End Mortgage
Purchase Details
Closed on
Nov 25, 1998
Sold by
Bonnallie Scott D and Bonnallie Kelly
Bought by
Clark Christopher J and Clark Melissa L
Purchase Details
Closed on
Jan 1, 1994
Purchase Details
Closed on
Oct 1, 1993
Create a Home Valuation Report for This Property
The Home Valuation Report is an in-depth analysis detailing your home's value as well as a comparison with similar homes in the area
Home Values in the Area
Average Home Value in this Area
Purchase History
| Date | Buyer | Sale Price | Title Company |
|---|---|---|---|
| Trivium Homes Llc-9411 S 88Th East Ave Protec | -- | Elite Title | |
| Trivium Homes Llc | $285,000 | Elite Title | |
| Hulsey Richard B | $147,500 | Multiple | |
| Clark Christopher J | $115,000 | Guaranty Abstract Company | |
| -- | $102,000 | -- | |
| -- | $16,000 | -- |
Source: Public Records
Mortgage History
| Date | Status | Borrower | Loan Amount |
|---|---|---|---|
| Previous Owner | Hulsey Richard B | $123,560 |
Source: Public Records
Tax History
| Year | Tax Paid | Tax Assessment Tax Assessment Total Assessment is a certain percentage of the fair market value that is determined by local assessors to be the total taxable value of land and additions on the property. | Land | Improvement |
|---|---|---|---|---|
| 2025 | $4,406 | $31,163 | $4,413 | $26,750 |
| 2024 | $2,594 | $20,461 | $3,038 | $17,423 |
| 2023 | $2,594 | $19,487 | $2,974 | $16,513 |
| 2022 | $2,548 | $18,559 | $4,064 | $14,495 |
| 2021 | $2,460 | $17,676 | $3,871 | $13,805 |
| 2020 | $2,321 | $17,037 | $3,731 | $13,306 |
| 2019 | $2,286 | $16,225 | $3,553 | $12,672 |
| 2018 | $2,284 | $16,225 | $3,553 | $12,672 |
| 2017 | $2,230 | $16,225 | $3,553 | $12,672 |
| 2016 | $2,239 | $16,225 | $3,553 | $12,672 |
| 2015 | $2,281 | $16,225 | $3,553 | $12,672 |
| 2014 | $2,197 | $16,665 | $3,553 | $13,112 |
Source: Public Records
Map
Nearby Homes
- 8841 E 93rd St
- 9364 S 89th East Ave
- 9526 S 88th East Ave
- 9225 S 91st East Ave
- 9139 S 90th East Ave
- 8702 E 91st Place
- 8518 E 97th St
- 9104 S 91st East Ave Unit Ave
- 9320 S 95th East Place
- 9028 E 99th St
- 9533 S 94th East Ave
- 9208 E 90th St
- 9109 E 88th Ct
- 9542 S 96th East Ave
- 9008 E 88th St
- 10056 S 91st East Ave
- 9014 E 87th Place
- 10026 S 93rd East Ave
- 9835 S 78th East Ave
- 9021 E 87th Place
- 9411 S 88th East Ave
- 9415 S 88th East Ave
- 9404 S 88th East Place
- 9419 S 88th East Ave
- 9408 S 88th East Place
- 8805 E 94th St
- 8811 E 94th St
- 9412 S 88th East Ave
- 9408 S 88th East Ave
- 9412 S 88th East Place
- 9423 S 88th East Ave
- 9312 S 88th East Place
- 9416 S 88th East Ave
- 8801 E 94th St
- 9404 S 88th East Ave
- 9416 S 88th East Place
- 9420 S 88th East Ave
- 9308 S 88th East Place
- 9427 S 88th East Ave
- 9424 S 88th East Ave
Your Personal Tour Guide
Ask me questions while you tour the home.