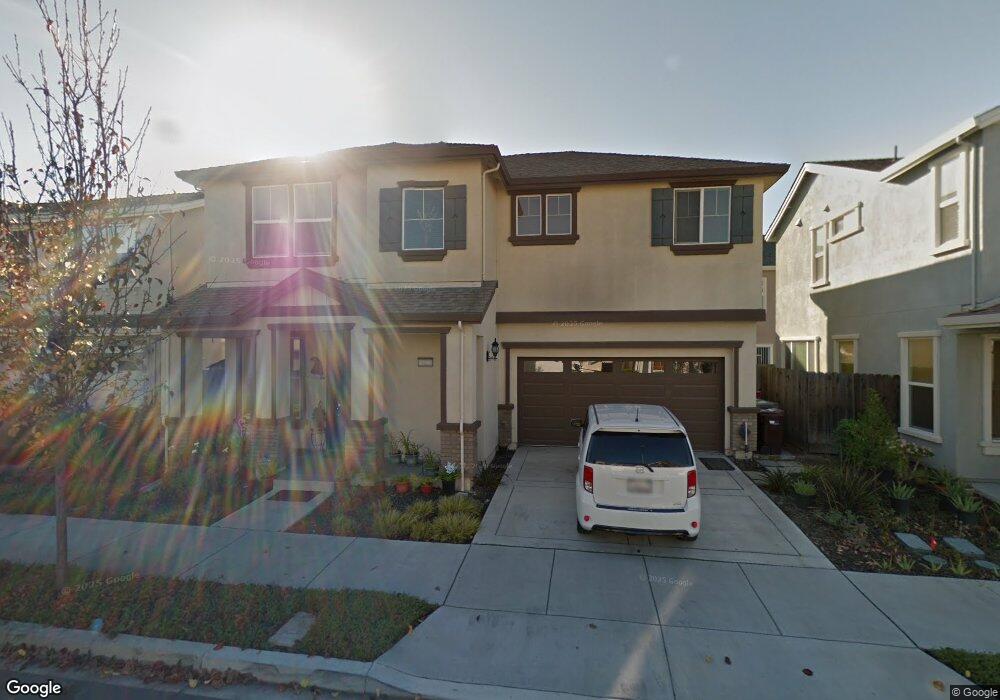
9413 Clemente Dr Oakland, CA 94603
Elmhurst Park NeighborhoodEstimated Value: $632,000 - $796,000
4
Beds
3
Baths
1,737
Sq Ft
$417/Sq Ft
Est. Value
About This Home
This home is located at 9413 Clemente Dr, Oakland, CA 94603 and is currently estimated at $723,504, approximately $416 per square foot. 9413 Clemente Dr is a home located in Alameda County with nearby schools including Fred T. Korematsu Discovery Academy, Esperanza Elementary School, and Madison Park Academy (6-12).
Ownership History
Date
Name
Owned For
Owner Type
Purchase Details
Closed on
Apr 10, 2021
Sold by
Condalor Kristian A and Condalor Jackylou D
Bought by
Condalor Kristian A and Condalor Jackylou D
Current Estimated Value
Home Financials for this Owner
Home Financials are based on the most recent Mortgage that was taken out on this home.
Original Mortgage
$496,000
Interest Rate
2.9%
Mortgage Type
New Conventional
Purchase Details
Closed on
Jan 19, 2010
Sold by
Pulte Home Corporation
Bought by
Condalor Kristians A and Condalor Jackylou D
Home Financials for this Owner
Home Financials are based on the most recent Mortgage that was taken out on this home.
Original Mortgage
$377,044
Interest Rate
5.25%
Mortgage Type
FHA
Create a Home Valuation Report for This Property
The Home Valuation Report is an in-depth analysis detailing your home's value as well as a comparison with similar homes in the area
Home Values in the Area
Average Home Value in this Area
Purchase History
| Date | Buyer | Sale Price | Title Company |
|---|---|---|---|
| Condalor Kristian A | $248,000 | Mortgage Connect Lp | |
| Condalor Kristians A | $384,000 | Chicago Title Company |
Source: Public Records
Mortgage History
| Date | Status | Borrower | Loan Amount |
|---|---|---|---|
| Previous Owner | Condalor Kristian A | $496,000 | |
| Previous Owner | Condalor Kristians A | $377,044 |
Source: Public Records
Tax History Compared to Growth
Tax History
| Year | Tax Paid | Tax Assessment Tax Assessment Total Assessment is a certain percentage of the fair market value that is determined by local assessors to be the total taxable value of land and additions on the property. | Land | Improvement |
|---|---|---|---|---|
| 2025 | $7,874 | $488,642 | $148,692 | $346,950 |
| 2024 | $7,874 | $478,925 | $145,777 | $340,148 |
| 2023 | $10,421 | $636,151 | $190,845 | $445,306 |
| 2022 | $7,993 | $460,058 | $140,117 | $326,941 |
| 2021 | $7,602 | $450,904 | $137,371 | $320,533 |
| 2020 | $7,517 | $453,211 | $135,963 | $317,248 |
| 2019 | $7,209 | $444,325 | $133,297 | $311,028 |
| 2018 | $6,956 | $435,617 | $130,685 | $304,932 |
| 2017 | $6,780 | $427,076 | $128,123 | $298,953 |
| 2016 | $6,531 | $418,705 | $125,611 | $293,094 |
| 2015 | $6,496 | $412,418 | $123,725 | $288,693 |
| 2014 | $6,548 | $404,344 | $121,303 | $283,041 |
Source: Public Records
Map
Nearby Homes