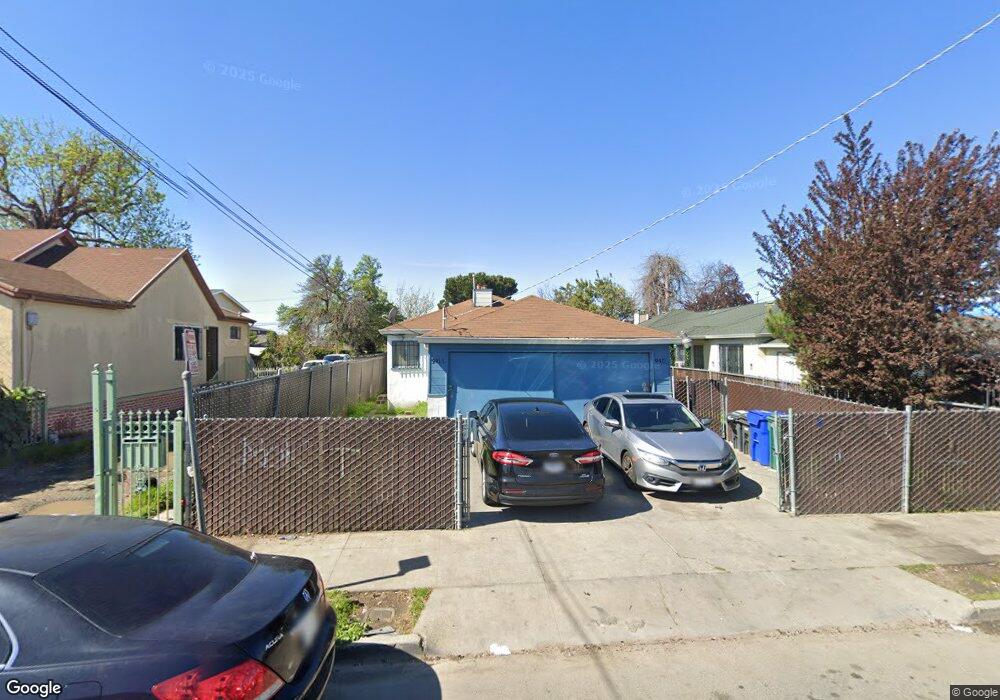
9415 C St Oakland, CA 94603
Elmhurst Park NeighborhoodEstimated Value: $533,000 - $584,000
4
Beds
2
Baths
1,664
Sq Ft
$339/Sq Ft
Est. Value
About This Home
This home is located at 9415 C St, Oakland, CA 94603 and is currently estimated at $563,589, approximately $338 per square foot. 9415 C St is a home located in Alameda County with nearby schools including Fred T. Korematsu Discovery Academy, Esperanza Elementary School, and Elmhurst United Middle School.
Ownership History
Date
Name
Owned For
Owner Type
Purchase Details
Closed on
Jun 3, 2021
Sold by
Greenwell Earlene B and Greenwell Jacob Sr
Bought by
Greenwell Earlene B and Greenwell Jacob
Current Estimated Value
Purchase Details
Closed on
Jul 7, 2011
Sold by
Greenwell Earlene B
Bought by
Greenwell Earlene B and Greenwell Jacob W
Purchase Details
Closed on
Feb 12, 1999
Sold by
Dawkins Booker T and Dawkins Craig
Bought by
Greenwell Jacob W and Greenwell Earlene B
Home Financials for this Owner
Home Financials are based on the most recent Mortgage that was taken out on this home.
Original Mortgage
$100,000
Outstanding Balance
$23,751
Interest Rate
6.78%
Estimated Equity
$539,838
Create a Home Valuation Report for This Property
The Home Valuation Report is an in-depth analysis detailing your home's value as well as a comparison with similar homes in the area
Home Values in the Area
Average Home Value in this Area
Purchase History
| Date | Buyer | Sale Price | Title Company |
|---|---|---|---|
| Greenwell Earlene B | -- | None Available | |
| Greenwell Earlene B | -- | None Available | |
| Greenwell Jacob W | $130,000 | First American Title Guarant |
Source: Public Records
Mortgage History
| Date | Status | Borrower | Loan Amount |
|---|---|---|---|
| Open | Greenwell Jacob W | $100,000 |
Source: Public Records
Tax History
| Year | Tax Paid | Tax Assessment Tax Assessment Total Assessment is a certain percentage of the fair market value that is determined by local assessors to be the total taxable value of land and additions on the property. | Land | Improvement |
|---|---|---|---|---|
| 2025 | $4,776 | $195,951 | $58,785 | $137,166 |
| 2024 | $4,776 | $192,110 | $57,633 | $134,477 |
| 2023 | $4,871 | $188,344 | $56,503 | $131,841 |
| 2022 | $4,610 | $184,651 | $55,395 | $129,256 |
| 2021 | $4,211 | $181,031 | $54,309 | $126,722 |
| 2020 | $4,161 | $179,175 | $53,752 | $125,423 |
| 2019 | $3,880 | $175,663 | $52,699 | $122,964 |
| 2018 | $3,802 | $172,220 | $51,666 | $120,554 |
| 2017 | $3,607 | $168,843 | $50,653 | $118,190 |
| 2016 | $3,418 | $165,533 | $49,660 | $115,873 |
| 2015 | $3,396 | $163,047 | $48,914 | $114,133 |
| 2014 | $3,430 | $159,853 | $47,956 | $111,897 |
Source: Public Records
Map
Nearby Homes
Your Personal Tour Guide
Ask me questions while you tour the home.