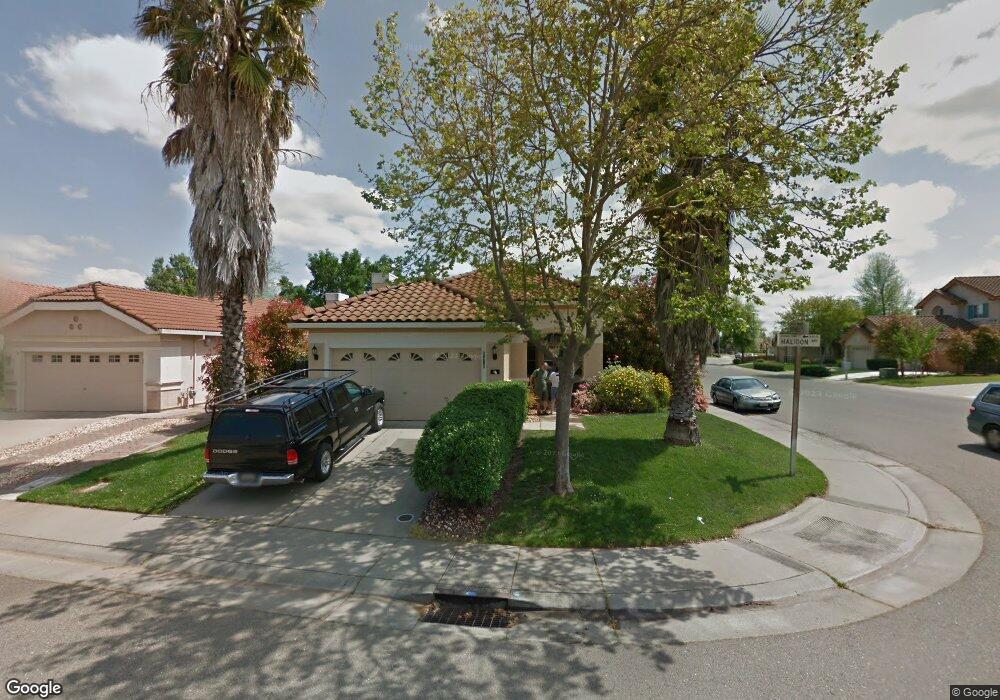
9416 Halidon Way Sacramento, CA 95829
Estimated Value: $341,000 - $495,000
3
Beds
2
Baths
1,350
Sq Ft
$326/Sq Ft
Est. Value
About This Home
This home is located at 9416 Halidon Way, Sacramento, CA 95829 and is currently estimated at $439,563, approximately $325 per square foot. 9416 Halidon Way is a home located in Sacramento County with nearby schools including Robert J. Fite Elementary School, T. R. Smedberg Middle School, and Sheldon High School.
Ownership History
Date
Name
Owned For
Owner Type
Purchase Details
Closed on
Jul 29, 2011
Sold by
Ing Bank Fsb
Bought by
Prasad Deepak and Prasad Hansni
Current Estimated Value
Home Financials for this Owner
Home Financials are based on the most recent Mortgage that was taken out on this home.
Original Mortgage
$113,250
Outstanding Balance
$78,010
Interest Rate
4.46%
Mortgage Type
New Conventional
Estimated Equity
$361,553
Purchase Details
Closed on
May 9, 2011
Sold by
Smith Venson C and Smith Linda S
Bought by
Ing Bank Fsb
Purchase Details
Closed on
Jun 15, 1995
Sold by
Elliott Homes Inc
Bought by
Smith Venson C and Smith Linda S
Home Financials for this Owner
Home Financials are based on the most recent Mortgage that was taken out on this home.
Original Mortgage
$128,469
Interest Rate
7.92%
Mortgage Type
Assumption
Create a Home Valuation Report for This Property
The Home Valuation Report is an in-depth analysis detailing your home's value as well as a comparison with similar homes in the area
Home Values in the Area
Average Home Value in this Area
Purchase History
| Date | Buyer | Sale Price | Title Company |
|---|---|---|---|
| Prasad Deepak | $151,000 | Equity Title Orange County I | |
| Ing Bank Fsb | $151,815 | Orange Coast Title | |
| Smith Venson C | $126,000 | Stewart Title | |
| Elliott Homes Inc | $27,500 | Stewart Title |
Source: Public Records
Mortgage History
| Date | Status | Borrower | Loan Amount |
|---|---|---|---|
| Open | Prasad Deepak | $113,250 | |
| Previous Owner | Elliott Homes Inc | $128,469 |
Source: Public Records
Tax History Compared to Growth
Tax History
| Year | Tax Paid | Tax Assessment Tax Assessment Total Assessment is a certain percentage of the fair market value that is determined by local assessors to be the total taxable value of land and additions on the property. | Land | Improvement |
|---|---|---|---|---|
| 2025 | $2,229 | $189,652 | $87,918 | $101,734 |
| 2024 | $2,229 | $185,935 | $86,195 | $99,740 |
| 2023 | $2,178 | $182,290 | $84,505 | $97,785 |
| 2022 | $2,143 | $178,717 | $82,849 | $95,868 |
| 2021 | $2,122 | $175,214 | $81,225 | $93,989 |
| 2020 | $2,096 | $173,419 | $80,393 | $93,026 |
| 2019 | $2,061 | $170,019 | $78,817 | $91,202 |
| 2018 | $2,010 | $166,686 | $77,272 | $89,414 |
| 2017 | $1,978 | $163,418 | $75,757 | $87,661 |
| 2016 | $1,886 | $160,215 | $74,272 | $85,943 |
| 2015 | $1,854 | $157,810 | $73,157 | $84,653 |
| 2014 | $1,826 | $154,719 | $71,724 | $82,995 |
Source: Public Records
Map
Nearby Homes
- 8174 Finmere Way
- 8298 Courage Dr
- 9363 Boscastle Way
- 9343 Boscastle Way
- 9287 Benefield Ct
- 8216 Rivallo Way
- 9273 Amarone Way
- 9244 Brevard Ct
- 8210 Scrimshaw Way
- 9401 Rogers Rd
- 7920 Kelvedon Way
- 8294 Courage Dr
- 9172 Durness Way
- 7984 Munhall Ct
- 9633 Respect Dr
- 7929 Symington Way
- 8054 Boeger Ct
- 7904 Symington Way
- 9865 Fall Valley Way
- 9169 Garlington Ct
- 9420 Halidon Way
- 8072 Bothwell Dr
- 9424 Halidon Way
- 8074 Bothwell Dr
- 8073 Bothwell Dr
- 8069 Bothwell Dr
- 9428 Halidon Way
- 9417 Halidon Way
- 8077 Bothwell Dr
- 9423 Halidon Way
- 9401 Kensal Ct
- 8078 Bothwell Dr
- 9405 Kensall Ct
- 9405 Kensal Ct
- 8061 Bothwell Dr
- 9429 Halidon Way
- 8081 Bothwell Dr
- 9404 Brownsberg Way
- 8082 Bothwell Dr
- 9409 Kensall Ct