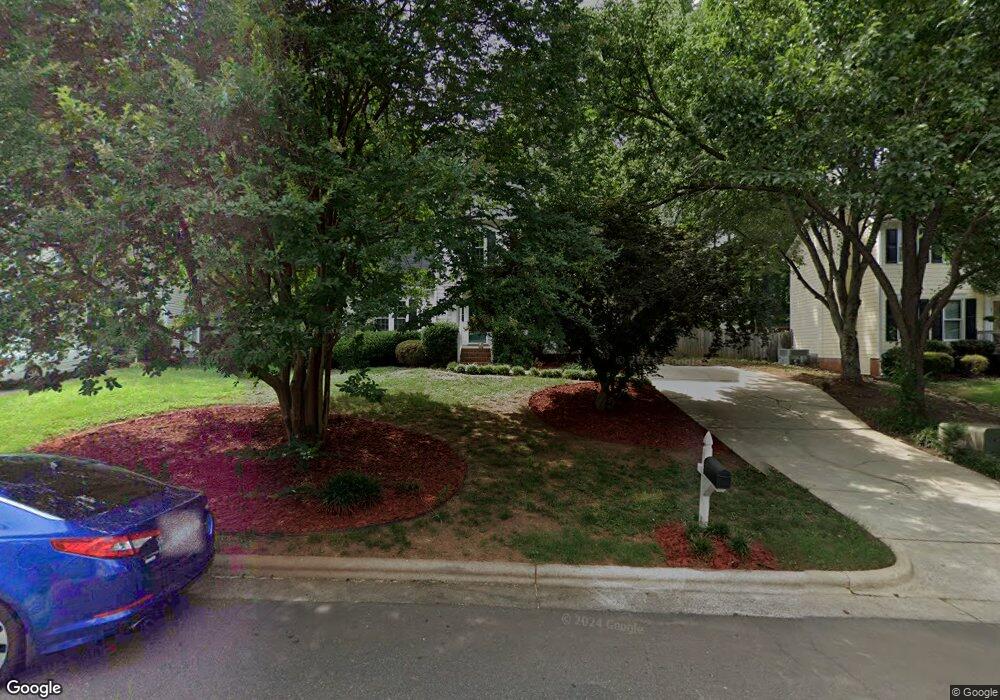
9417 Cartersville Ct Raleigh, NC 27617
Umstead NeighborhoodEstimated Value: $403,000 - $428,000
3
Beds
3
Baths
1,691
Sq Ft
$248/Sq Ft
Est. Value
About This Home
This home is located at 9417 Cartersville Ct, Raleigh, NC 27617 and is currently estimated at $418,855, approximately $247 per square foot. 9417 Cartersville Ct is a home located in Wake County with nearby schools including Sycamore Creek Elementary School, Pine Hollow Middle School, and Leesville Road High School.
Ownership History
Date
Name
Owned For
Owner Type
Purchase Details
Closed on
Jul 23, 2014
Sold by
Smith Matthew D and Smith Courtney
Bought by
Peterson Justin and Brocar Heather
Current Estimated Value
Home Financials for this Owner
Home Financials are based on the most recent Mortgage that was taken out on this home.
Original Mortgage
$204,300
Outstanding Balance
$156,197
Interest Rate
4.26%
Mortgage Type
VA
Estimated Equity
$262,658
Purchase Details
Closed on
Mar 30, 2001
Sold by
Murray Eric B
Bought by
Smith Matthew D and Smith Courtney
Home Financials for this Owner
Home Financials are based on the most recent Mortgage that was taken out on this home.
Original Mortgage
$120,000
Interest Rate
7.02%
Purchase Details
Closed on
Apr 17, 1998
Sold by
Murray Fred A and Murray Kathe K
Bought by
Murray Eric B and Murray Terry W
Home Financials for this Owner
Home Financials are based on the most recent Mortgage that was taken out on this home.
Original Mortgage
$112,500
Interest Rate
7.02%
Create a Home Valuation Report for This Property
The Home Valuation Report is an in-depth analysis detailing your home's value as well as a comparison with similar homes in the area
Home Values in the Area
Average Home Value in this Area
Purchase History
| Date | Buyer | Sale Price | Title Company |
|---|---|---|---|
| Peterson Justin | $200,000 | None Available | |
| Smith Matthew D | $150,000 | -- | |
| Murray Eric B | -- | -- |
Source: Public Records
Mortgage History
| Date | Status | Borrower | Loan Amount |
|---|---|---|---|
| Open | Peterson Justin | $204,300 | |
| Previous Owner | Smith Matthew D | $120,000 | |
| Previous Owner | Murray Eric B | $112,500 | |
| Closed | Smith Matthew D | $22,500 |
Source: Public Records
Tax History Compared to Growth
Tax History
| Year | Tax Paid | Tax Assessment Tax Assessment Total Assessment is a certain percentage of the fair market value that is determined by local assessors to be the total taxable value of land and additions on the property. | Land | Improvement |
|---|---|---|---|---|
| 2025 | $3,169 | $361,119 | $140,000 | $221,119 |
| 2024 | $3,156 | $361,119 | $140,000 | $221,119 |
| 2023 | $2,694 | $245,366 | $75,000 | $170,366 |
| 2022 | $2,504 | $245,366 | $75,000 | $170,366 |
| 2021 | $2,327 | $237,107 | $75,000 | $162,107 |
| 2020 | $2,285 | $237,107 | $75,000 | $162,107 |
| 2019 | $2,389 | $204,444 | $75,000 | $129,444 |
| 2018 | $2,254 | $204,444 | $75,000 | $129,444 |
| 2017 | $2,147 | $204,444 | $75,000 | $129,444 |
| 2016 | $2,103 | $204,444 | $75,000 | $129,444 |
| 2015 | $2,094 | $200,328 | $72,000 | $128,328 |
| 2014 | -- | $200,328 | $72,000 | $128,328 |
Source: Public Records
Map
Nearby Homes
- 9413 Bells Valley Dr
- 6516 Englehardt Dr
- 7846 Cape Charles Dr
- 7862 Cape Charles Dr
- 10901 Bayflower Way
- 10907 Bayflower Way
- 10917 Bayflower Way
- 9808 Goodrum Ct
- 10900 Bayflower Way
- 5950 Dunzo Dr
- 10906 Bayflower Way
- 5900 Dunzo Dr
- 5952 Dunzo Dr
- 5902 Dunzo Dr
- 5956 Dunzo Dr
- 5904 Dunzo Dr
- 5906 Dunzo Dr
- 6108 Dunzo Dr
- 6123 Blakeman Ln
- 6920 Lamarsh Ct
- 9421 Cartersville Ct
- 9413 Cartersville Ct
- 9425 Cartersville Ct
- 9409 Cartersville Ct
- 9504 Center Cross Ct
- 9420 Dominion Blvd
- 9424 Dominion Blvd
- 9508 Center Cross Ct
- 9416 Cartersville Ct
- 9412 Cartersville Ct
- 9416 Dominion Blvd
- 9512 Center Cross Ct
- 9420 Cartersville Ct
- 9429 Cartersville Ct
- 9428 Dominion Blvd
- 9405 Cartersville Ct
- 9408 Cartersville Ct
- 9424 Cartersville Ct
- 9516 Center Cross Ct
- 9412 Dominion Blvd