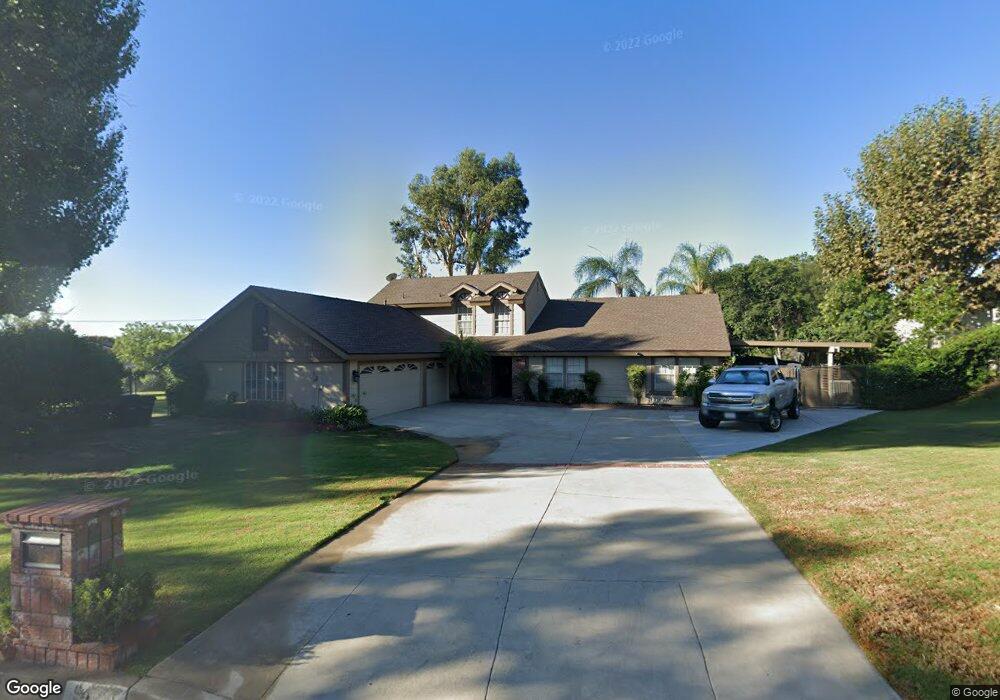
9419 Coca St Rancho Cucamonga, CA 91737
Alta Loma NeighborhoodEstimated Value: $1,173,227 - $1,305,000
5
Beds
3
Baths
2,949
Sq Ft
$424/Sq Ft
Est. Value
About This Home
This home is located at 9419 Coca St, Rancho Cucamonga, CA 91737 and is currently estimated at $1,249,057, approximately $423 per square foot. 9419 Coca St is a home located in San Bernardino County with nearby schools including Floyd M. Stork Elementary, Alta Loma Junior High, and Los Osos High.
Ownership History
Date
Name
Owned For
Owner Type
Purchase Details
Closed on
Dec 28, 2012
Sold by
Sanders Richard A
Bought by
Sanders Richard A
Current Estimated Value
Home Financials for this Owner
Home Financials are based on the most recent Mortgage that was taken out on this home.
Original Mortgage
$188,650
Outstanding Balance
$130,862
Interest Rate
3.32%
Mortgage Type
New Conventional
Estimated Equity
$1,118,195
Purchase Details
Closed on
May 19, 1998
Sold by
Associates Home Equity Services Inc
Bought by
Sanders Richard A and Sanders Angela D
Home Financials for this Owner
Home Financials are based on the most recent Mortgage that was taken out on this home.
Original Mortgage
$184,500
Interest Rate
7.13%
Purchase Details
Closed on
Jan 16, 1998
Sold by
Dubinsky John F and Dubinsky Beverly
Bought by
Ford Consumer Finance Company Inc
Create a Home Valuation Report for This Property
The Home Valuation Report is an in-depth analysis detailing your home's value as well as a comparison with similar homes in the area
Home Values in the Area
Average Home Value in this Area
Purchase History
| Date | Buyer | Sale Price | Title Company |
|---|---|---|---|
| Sanders Richard A | -- | First American Els | |
| Sanders Richard A | $247,000 | Benefit Land Title Company | |
| Ford Consumer Finance Company Inc | $30,000 | Benefit Land Title Ins Co |
Source: Public Records
Mortgage History
| Date | Status | Borrower | Loan Amount |
|---|---|---|---|
| Open | Sanders Richard A | $188,650 | |
| Closed | Sanders Richard A | $184,500 |
Source: Public Records
Tax History
| Year | Tax Paid | Tax Assessment Tax Assessment Total Assessment is a certain percentage of the fair market value that is determined by local assessors to be the total taxable value of land and additions on the property. | Land | Improvement |
|---|---|---|---|---|
| 2025 | $4,510 | $404,959 | $141,096 | $263,863 |
| 2024 | $4,397 | $397,018 | $138,329 | $258,689 |
| 2023 | $4,298 | $389,234 | $135,617 | $253,617 |
| 2022 | $4,287 | $381,602 | $132,958 | $248,644 |
| 2021 | $4,286 | $374,120 | $130,351 | $243,769 |
| 2020 | $4,033 | $370,283 | $129,014 | $241,269 |
| 2019 | $4,078 | $363,022 | $126,484 | $236,538 |
| 2018 | $3,985 | $355,904 | $124,004 | $231,900 |
| 2017 | $3,802 | $348,926 | $121,573 | $227,353 |
| 2016 | $3,697 | $342,084 | $119,189 | $222,895 |
| 2015 | $3,673 | $336,946 | $117,399 | $219,547 |
| 2014 | $3,568 | $330,345 | $115,099 | $215,246 |
Source: Public Records
Map
Nearby Homes
- 6087 Amethyst St
- 9221 Banyan St
- 5895 Jadeite Ave
- 9735 Liberty Ct
- 9737 Liberty Ct
- 6285 Beryl St
- 9805 Liberty St
- 5836 Buckthorn Ave
- 5848 Burlwood Ct
- 6471 Caledon Place
- 6433 Aleatico Place
- 9979 Timbermist Ct
- 9160 Garden St
- 6639 Eastwood Ave
- 6340 Sacramento Ave
- 8919 Alta Loma Dr
- 9680 Cabot Ct Unit 7
- 9165 Camellia Ct
- 8851 Beechwood Dr
- 9220 Camellia Ct
- 9399 Coca St
- 9414 Banyan St
- 9424 Banyan St
- 9400 Banyan St
- 6024 Layton St
- 6035 Layton St
- 9383 Coca St
- 6065 Layton St
- 9386 Banyan St
- 6077 Layton St
- 6021 Kirkwood Ave
- 6025 Layton St
- 6006 Layton St
- 9373 Coca St
- 6095 Layton St
- 9370 Banyan St
- 6103 Onyx Ave
- 6011 Layton St
- 6005 Kirkwood Ave
- 6030 Kirkwood Ave
Your Personal Tour Guide
Ask me questions while you tour the home.