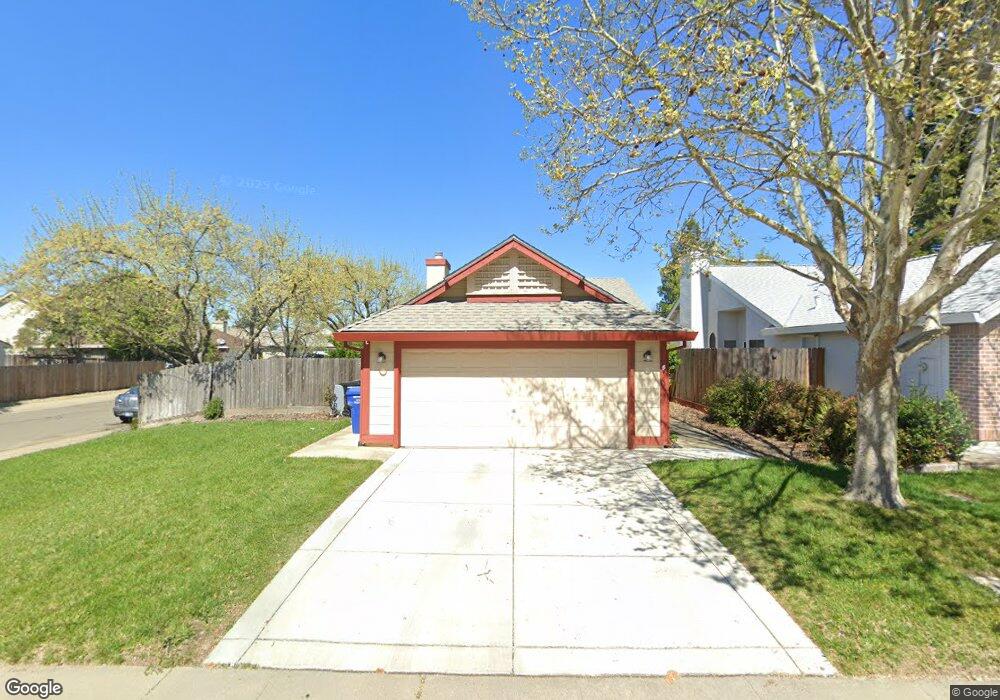
9419 Morcott Way Sacramento, CA 95829
Estimated Value: $362,000 - $492,000
3
Beds
2
Baths
1,160
Sq Ft
$384/Sq Ft
Est. Value
About This Home
This home is located at 9419 Morcott Way, Sacramento, CA 95829 and is currently estimated at $444,935, approximately $383 per square foot. 9419 Morcott Way is a home located in Sacramento County with nearby schools including Robert J. Fite Elementary School, T. R. Smedberg Middle School, and Sheldon High School.
Ownership History
Date
Name
Owned For
Owner Type
Purchase Details
Closed on
Jan 17, 2007
Sold by
Benson Brian R and Benson Mari Lyn
Bought by
Benson Brian R and Benson Mari Lyn
Current Estimated Value
Purchase Details
Closed on
Oct 14, 2002
Sold by
Jaramillo Ken and Jaramillo Lynette
Bought by
Benson Brian R and Benson Mari Lyn
Home Financials for this Owner
Home Financials are based on the most recent Mortgage that was taken out on this home.
Original Mortgage
$201,287
Outstanding Balance
$83,709
Interest Rate
6.05%
Mortgage Type
FHA
Estimated Equity
$361,226
Purchase Details
Closed on
Jul 18, 1997
Sold by
Calamia Gaspar and Calamia Wendy A
Bought by
Jaramillo Ken and Jaramillo Lynette
Home Financials for this Owner
Home Financials are based on the most recent Mortgage that was taken out on this home.
Original Mortgage
$109,650
Interest Rate
7.42%
Mortgage Type
FHA
Create a Home Valuation Report for This Property
The Home Valuation Report is an in-depth analysis detailing your home's value as well as a comparison with similar homes in the area
Home Values in the Area
Average Home Value in this Area
Purchase History
| Date | Buyer | Sale Price | Title Company |
|---|---|---|---|
| Benson Brian R | -- | None Available | |
| Benson Brian R | $208,000 | Fidelity National Title Co | |
| Jaramillo Ken | $111,000 | Fidelity National Title Ins |
Source: Public Records
Mortgage History
| Date | Status | Borrower | Loan Amount |
|---|---|---|---|
| Open | Benson Brian R | $201,287 | |
| Previous Owner | Jaramillo Ken | $109,650 |
Source: Public Records
Tax History Compared to Growth
Tax History
| Year | Tax Paid | Tax Assessment Tax Assessment Total Assessment is a certain percentage of the fair market value that is determined by local assessors to be the total taxable value of land and additions on the property. | Land | Improvement |
|---|---|---|---|---|
| 2025 | $3,313 | $301,235 | $65,165 | $236,070 |
| 2024 | $3,313 | $295,330 | $63,888 | $231,442 |
| 2023 | $3,231 | $289,540 | $62,636 | $226,904 |
| 2022 | $3,177 | $283,863 | $61,408 | $222,455 |
| 2021 | $3,142 | $278,298 | $60,204 | $218,094 |
| 2020 | $3,100 | $275,445 | $59,587 | $215,858 |
| 2019 | $3,045 | $270,045 | $58,419 | $211,626 |
| 2018 | $2,965 | $264,751 | $57,274 | $207,477 |
| 2017 | $2,914 | $259,560 | $56,151 | $203,409 |
| 2016 | $2,771 | $254,471 | $55,050 | $199,421 |
| 2015 | $2,720 | $250,650 | $54,224 | $196,426 |
| 2014 | $2,676 | $245,741 | $53,162 | $192,579 |
Source: Public Records
Map
Nearby Homes
- 9363 Boscastle Way
- 9343 Boscastle Way
- 8174 Finmere Way
- 8216 Rivallo Way
- 8298 Courage Dr
- 9287 Benefield Ct
- 8210 Scrimshaw Way
- 9273 Amarone Way
- 8294 Courage Dr
- 9244 Brevard Ct
- 9172 Durness Way
- 9169 Garlington Ct
- 9209 Rosecut Ct
- 7920 Kelvedon Way
- 7984 Munhall Ct
- 8054 Boeger Ct
- 9633 Respect Dr
- 9279 Prudhoe Ct
- 9040 Durness Way
- 9401 Rogers Rd
- 9423 Morcott Way
- 8143 Munslow Way
- 9409 Morcott Way
- 8139 Munslow Way
- 8150 Kingsbridge Dr
- 8154 Kingsbridge Dr
- 8146 Kingsbridge Dr
- 8144 Munslow Way
- 9420 Morcott Way
- 9416 Morcott Way
- 9405 Morcott Way
- 9424 Morcott Way
- 9412 Morcott Way
- 8142 Kingsbridge Dr
- 8140 Munslow Way
- 8135 Munslow Way
- 8164 Kingsbridge Dr
- 9408 Morcott Way
- 9401 Morcott Way
- 8136 Munslow Way