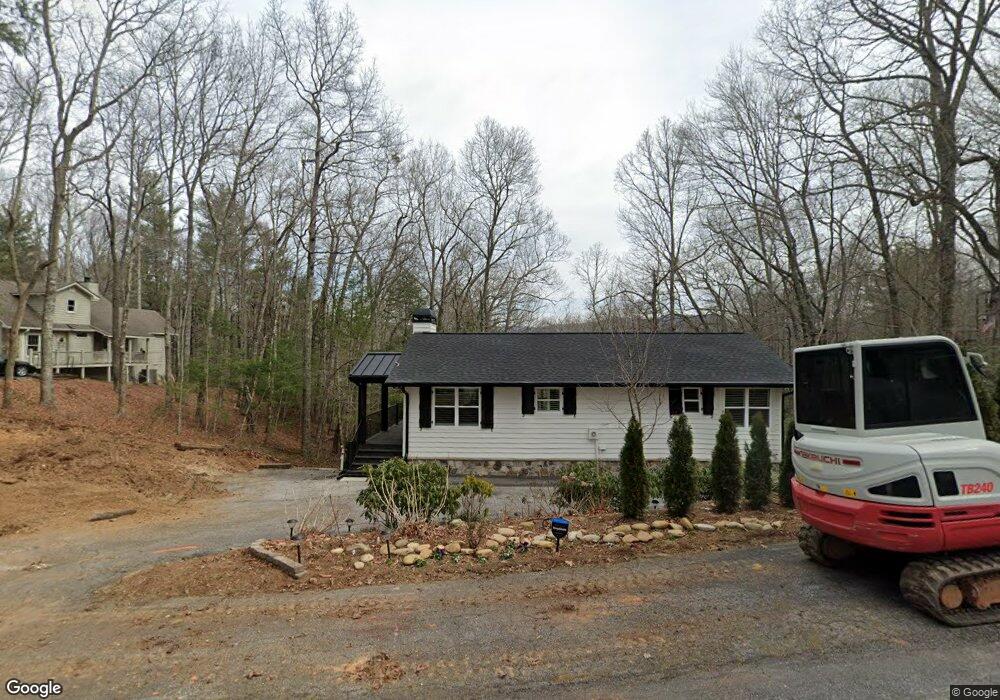
942 Alpine Dr Unit 172 Dillard, GA 30537
Estimated Value: $355,000 - $443,271
3
Beds
4
Baths
2,112
Sq Ft
$190/Sq Ft
Est. Value
About This Home
This home is located at 942 Alpine Dr Unit 172, Dillard, GA 30537 and is currently estimated at $400,818, approximately $189 per square foot. 942 Alpine Dr Unit 172 is a home located in Rabun County with nearby schools including Rabun County Primary School and Rabun County High School.
Ownership History
Date
Name
Owned For
Owner Type
Purchase Details
Closed on
Jul 26, 2018
Sold by
Requena Jan
Bought by
Grant Ralph L
Current Estimated Value
Purchase Details
Closed on
Jul 13, 2017
Sold by
Borman Jay L
Bought by
Requena Jan
Home Financials for this Owner
Home Financials are based on the most recent Mortgage that was taken out on this home.
Original Mortgage
$146,464
Interest Rate
3.91%
Mortgage Type
New Conventional
Purchase Details
Closed on
May 27, 2016
Sold by
Borman Jay L
Bought by
Borman Jay L and Borman Delores A
Purchase Details
Closed on
Oct 31, 2014
Sold by
Borman Jay L
Bought by
Borman Jay L and Borman Dolores A
Purchase Details
Closed on
Jan 1, 1993
Bought by
Borman Jay L / Dolores
Purchase Details
Closed on
Jul 1, 1990
Purchase Details
Closed on
Oct 1, 1979
Create a Home Valuation Report for This Property
The Home Valuation Report is an in-depth analysis detailing your home's value as well as a comparison with similar homes in the area
Home Values in the Area
Average Home Value in this Area
Purchase History
| Date | Buyer | Sale Price | Title Company |
|---|---|---|---|
| Grant Ralph L | $158,450 | -- | |
| Grant Ralph L | $158,450 | -- | |
| Requena Jan | $145,000 | -- | |
| Requena Jan | $145,000 | -- | |
| Borman Jay L | $114,809 | -- | |
| Borman Jay L | $114,809 | -- | |
| Borman Jay L | -- | -- | |
| Borman Jay L | -- | -- | |
| Borman Jay L / Dolores | $71,000 | -- | |
| Borman Jay L / Dolores | $71,000 | -- | |
| -- | -- | -- | |
| -- | -- | -- | |
| -- | $11,200 | -- | |
| -- | $11,200 | -- |
Source: Public Records
Mortgage History
| Date | Status | Borrower | Loan Amount |
|---|---|---|---|
| Previous Owner | Requena Jan | $146,464 |
Source: Public Records
Tax History
| Year | Tax Paid | Tax Assessment Tax Assessment Total Assessment is a certain percentage of the fair market value that is determined by local assessors to be the total taxable value of land and additions on the property. | Land | Improvement |
|---|---|---|---|---|
| 2025 | $3,729 | $134,989 | $22,000 | $112,989 |
| 2024 | $3,534 | $127,945 | $22,000 | $105,945 |
| 2023 | $3,357 | $107,287 | $17,600 | $89,687 |
| 2022 | $1,333 | $72,834 | $15,400 | $57,434 |
| 2021 | $1,075 | $57,318 | $8,800 | $48,518 |
| 2020 | $1,015 | $52,312 | $8,800 | $43,512 |
| 2019 | $1,022 | $52,312 | $8,800 | $43,512 |
| 2018 | $1,026 | $52,312 | $8,800 | $43,512 |
| 2017 | $910 | $48,415 | $8,800 | $39,615 |
| 2016 | $913 | $48,415 | $8,800 | $39,615 |
| 2015 | $884 | $45,924 | $8,800 | $37,124 |
| 2014 | $889 | $45,924 | $8,800 | $37,124 |
Source: Public Records
Map
Nearby Homes
- 79 Alex Mountain Dr
- Lot 1 Ridgepole Dr
- LOT 17 Ridgepole Dr
- TBD Ridgepole Dr
- 388 Alex Mountain Dr
- 578 Saddleback Cir
- 499 Ridgepole Dr
- 291 Saddleback Cir
- 0 Evergreen Ln Unit 10649699
- 0 Evergreen Ln Unit 7662581
- 0 Evergreen Ln Unit 10621047
- 0 Evergreen Ln Unit 7686011
- 62 Sun Valley Cir Unit 7002
- 62 Sun Valley Cir Unit 7006
- 0 Ridgepole Dr SE Unit 10557269
- 0 Ridgepole Dr SE Unit 26020295
- 452 E Sugarbush Dr
- 156 Tahoe Ln
- 0 Saddleback Cir Unit 10538862
- 374 W Sugarbush Dr
- 942 Alpine Dr
- 942 Alpine Dr
- 942 Alpine Dr
- 942 Alpine Dr Unit 172
- 942 Alpine Ln Unit 172
- 960 Alpine Dr
- 896 Alpine Dr Unit 171
- 896 Alpine Dr
- 896 Alpine Dr
- 896 Alpine Dr Unit 171
- 997 Ridgepole Dr
- 95 La Belle Cir
- 67 Downing St
- 497 497 Labelle Cir
- 84 La Belle Cir
- 37 La Belle Cir
- 0 Schonberg Lane (Ridgepole Pt 9) Unit 247 10043184
- 0 Schonberg Lane (Ridgepole Pt 9) Unit 247 7026364
- Lot#247 Ridgepole Part 9
- 90 Downing St
Your Personal Tour Guide
Ask me questions while you tour the home.