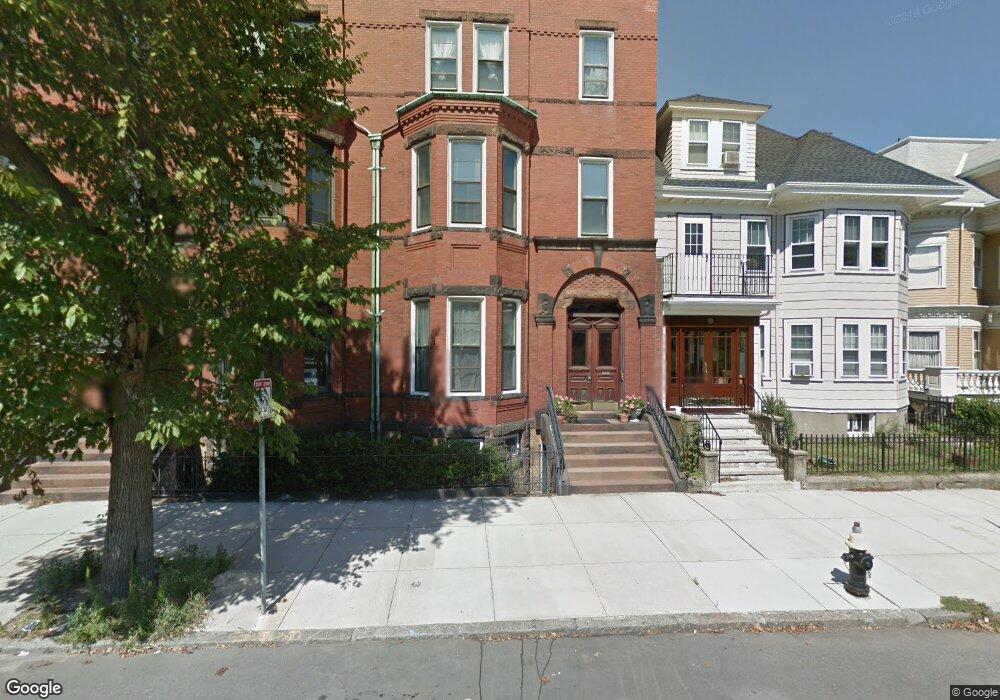
942 E Broadway Boston, MA 02127
South Boston NeighborhoodEstimated Value: $2,222,000 - $2,614,000
5
Beds
5
Baths
3,960
Sq Ft
$590/Sq Ft
Est. Value
About This Home
This home is located at 942 E Broadway, Boston, MA 02127 and is currently estimated at $2,336,458, approximately $590 per square foot. 942 E Broadway is a home located in Suffolk County with nearby schools including South Boston Catholic Academy, Gate of Heaven Elementary School, and St Peter Academy.
Ownership History
Date
Name
Owned For
Owner Type
Purchase Details
Closed on
Mar 4, 2024
Sold by
Evans William B and Evans Therese N
Bought by
Evans Ft and Evans
Current Estimated Value
Purchase Details
Closed on
Jun 15, 2000
Sold by
Dahill Richard J and Jacoby Gail
Bought by
Eavans William B and Evans Theresa W
Create a Home Valuation Report for This Property
The Home Valuation Report is an in-depth analysis detailing your home's value as well as a comparison with similar homes in the area
Home Values in the Area
Average Home Value in this Area
Purchase History
| Date | Buyer | Sale Price | Title Company |
|---|---|---|---|
| Evans Ft | -- | None Available | |
| Evans Ft | -- | None Available | |
| Eavans William B | $650,000 | -- | |
| Eavans William B | $650,000 | -- |
Source: Public Records
Mortgage History
| Date | Status | Borrower | Loan Amount |
|---|---|---|---|
| Previous Owner | Eavans William B | $460,000 | |
| Previous Owner | Eavans William B | $600,000 | |
| Previous Owner | Eavans William B | $600,000 |
Source: Public Records
Tax History
| Year | Tax Paid | Tax Assessment Tax Assessment Total Assessment is a certain percentage of the fair market value that is determined by local assessors to be the total taxable value of land and additions on the property. | Land | Improvement |
|---|---|---|---|---|
| 2025 | $23,023 | $1,988,200 | $483,200 | $1,505,000 |
| 2024 | $21,607 | $1,982,300 | $394,000 | $1,588,300 |
| 2023 | $19,708 | $1,835,000 | $364,700 | $1,470,300 |
| 2022 | $18,150 | $1,668,200 | $331,600 | $1,336,600 |
| 2021 | $17,281 | $1,619,600 | $321,900 | $1,297,700 |
| 2020 | $13,576 | $1,285,600 | $305,000 | $980,600 |
| 2019 | $12,901 | $1,224,000 | $239,400 | $984,600 |
| 2018 | $11,992 | $1,144,300 | $239,400 | $904,900 |
| 2017 | $11,541 | $1,089,800 | $239,400 | $850,400 |
| 2016 | $11,100 | $1,009,100 | $239,400 | $769,700 |
| 2015 | $12,110 | $1,000,000 | $199,500 | $800,500 |
| 2014 | $11,008 | $875,000 | $199,500 | $675,500 |
Source: Public Records
Map
Nearby Homes
- 933 E Broadway
- 901 E Broadway Unit 1
- 37 Farragut Rd Unit 7
- 37 Farragut Rd Unit 6
- 37 Farragut Rd Unit Four
- 37 Farragut Rd Unit 3
- 37 Farragut Rd Unit 5
- 37 Farragut Rd Unit 2
- 38 P St Unit 3
- 1 Twomey Ct Unit 40
- 802 E 3rd St Unit 3
- 885 E Broadway
- 881 E 2nd St Unit 13
- 33 Lennon Ct Unit 39
- 867 E Broadway
- 7 Kemble Place
- 861 E Broadway
- 862 E 2nd St Unit 6
- 891 E 1st St Unit 4
- 840 E 4th St Unit 1
- 940 E Broadway
- 944 E Broadway Unit 1
- 944 E Broadway
- 944 E Broadway Unit 2
- 944 E Broadway Unit 3
- 938 E Broadway
- 936 E Broadway
- 948 E Broadway
- 934 E Broadway
- 950 E Broadway
- 837 E 3rd St Unit 2
- 837 E 3rd St
- 841 E 3rd St Unit 3
- 841 E 3rd St
- 833 E 3rd St
- 831 E 3rd St
- 829 E 3rd St
- 845 E 3rd St
- 952 E Broadway
- 952 E Broadway Unit 3
Your Personal Tour Guide
Ask me questions while you tour the home.