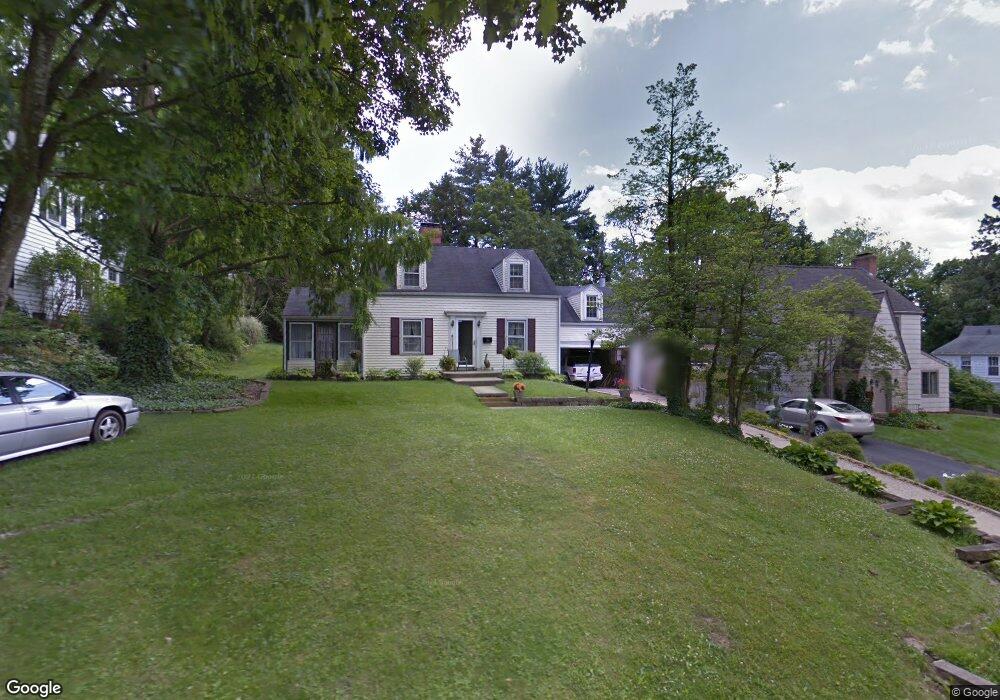
942 E High St Mount Vernon, OH 43050
Estimated Value: $250,220 - $298,000
4
Beds
2
Baths
1,492
Sq Ft
$183/Sq Ft
Est. Value
About This Home
This home is located at 942 E High St, Mount Vernon, OH 43050 and is currently estimated at $273,055, approximately $183 per square foot. 942 E High St is a home located in Knox County with nearby schools including Mount Vernon High School, St. Vincent de Paul School, and Christian Star Academy.
Ownership History
Date
Name
Owned For
Owner Type
Purchase Details
Closed on
Dec 27, 2018
Sold by
Mcneil Floyd C
Bought by
Kreps Karen S
Current Estimated Value
Purchase Details
Closed on
Jul 28, 2008
Sold by
Depolo Jay
Bought by
Mcneil Floyd C and Kreps Karen S
Home Financials for this Owner
Home Financials are based on the most recent Mortgage that was taken out on this home.
Original Mortgage
$116,000
Interest Rate
6.36%
Mortgage Type
New Conventional
Purchase Details
Closed on
Dec 1, 2003
Sold by
Miller W C
Bought by
Depolo Jay
Purchase Details
Closed on
Oct 4, 2002
Sold by
Miller Miller W W and Miller Marjorie
Bought by
Miller W C
Purchase Details
Closed on
Apr 23, 1993
Sold by
Sink David
Bought by
Miller Miller W and Miller Marjorie
Purchase Details
Closed on
Apr 2, 1986
Sold by
Gilman Peter A and Gilman Cynthia
Bought by
Sink David
Create a Home Valuation Report for This Property
The Home Valuation Report is an in-depth analysis detailing your home's value as well as a comparison with similar homes in the area
Home Values in the Area
Average Home Value in this Area
Purchase History
| Date | Buyer | Sale Price | Title Company |
|---|---|---|---|
| Kreps Karen S | -- | -- | |
| Mcneil Floyd C | $108,750 | None Available | |
| Depolo Jay | $116,900 | -- | |
| Miller W C | -- | -- | |
| Miller Miller W | $72,000 | -- | |
| Sink David | $54,500 | -- |
Source: Public Records
Mortgage History
| Date | Status | Borrower | Loan Amount |
|---|---|---|---|
| Previous Owner | Mcneil Floyd C | $116,000 |
Source: Public Records
Tax History
| Year | Tax Paid | Tax Assessment Tax Assessment Total Assessment is a certain percentage of the fair market value that is determined by local assessors to be the total taxable value of land and additions on the property. | Land | Improvement |
|---|---|---|---|---|
| 2024 | $1,686 | $64,980 | $12,550 | $52,430 |
| 2023 | $2,128 | $64,980 | $12,550 | $52,430 |
| 2022 | $1,530 | $44,820 | $8,660 | $36,160 |
| 2021 | $1,530 | $44,820 | $8,660 | $36,160 |
| 2020 | $1,491 | $44,820 | $8,660 | $36,160 |
| 2019 | $1,365 | $39,530 | $11,690 | $27,840 |
| 2018 | $1,365 | $39,530 | $11,690 | $27,840 |
| 2017 | $1,341 | $39,530 | $11,690 | $27,840 |
| 2016 | $1,216 | $36,600 | $10,820 | $25,780 |
| 2015 | $1,221 | $36,600 | $10,820 | $25,780 |
| 2014 | $1,227 | $36,600 | $10,820 | $25,780 |
| 2013 | $1,282 | $36,420 | $10,530 | $25,890 |
Source: Public Records
Map
Nearby Homes
- 6 Edgewood Blvd
- 501 Oak St
- 108 Ringold St
- 900 E Gambier St
- 600 1/2 E Chestnut St
- 600 E Chestnut St Unit 1/2
- 4 Craig Dr
- 604 E Gambier St
- 655 Howard St
- 220 Coshocton Ave
- 200 Eastwood Dr
- 213 Coshocton Ave
- 0 Miami St
- 418 E Pleasant St
- 18 Woodlake Trail
- 104 N Park St
- 612 N Clinton St
- 208 E Burgess St
- 26-30 Dogwood Terrace
- 12 3rd Ave
- 944 E High St
- 938 E High St
- 1115 E Vine St
- 1113 E Vine St
- 0 New Gambier Rd Unit 775000
- 0 New Gambier Rd Unit 4038934
- 0 New Gambier Rd Unit 223018179
- 0 New Gambier Rd Unit 20140993
- 0 New Gambier Rd Unit 20150220
- 0 New Gambier Rd Unit 20180918
- 0 New Gambier Rd Unit 20180916
- 0 New Gambier Rd Unit 20180915
- 0 New Gambier Rd Unit 20180914
- 0 New Gambier Rd Unit 20190393
- 0 New Gambier Rd Unit Lot C 218035618
- 0 New Gambier Rd Unit Lot B 218035616
- 0 New Gambier Rd Unit Lot A 218035614
- 0 New Gambier Rd Unit 218035609
- 939 E High St
- 2 N Edgewood Rd
Your Personal Tour Guide
Ask me questions while you tour the home.