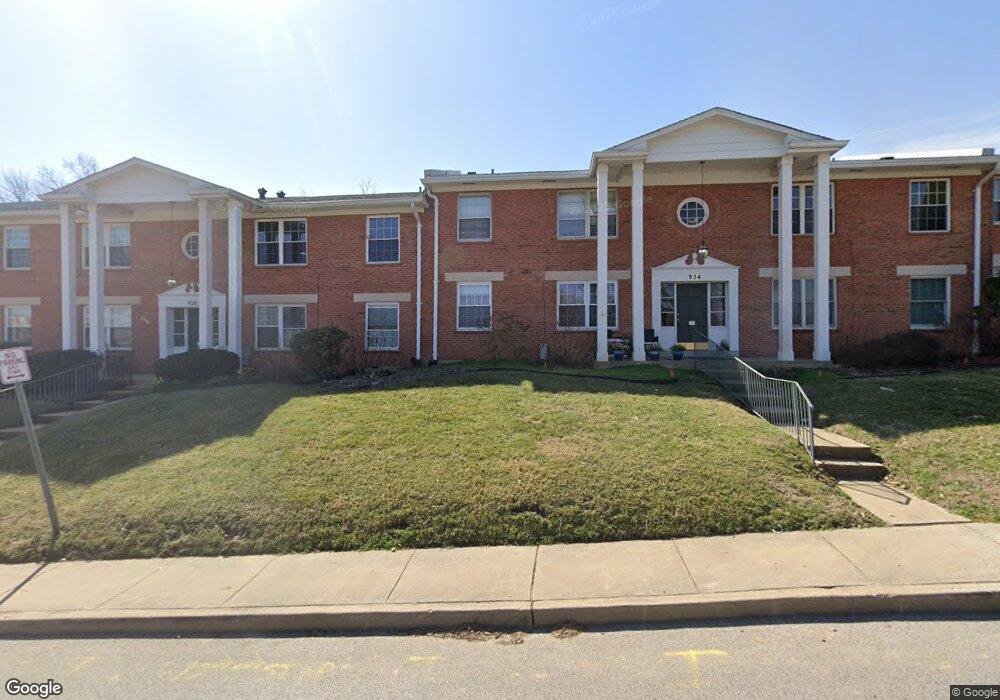
942 Marshall Ave Unit D Saint Louis, MO 63119
Estimated Value: $112,000 - $146,000
2
Beds
1
Bath
786
Sq Ft
$157/Sq Ft
Est. Value
About This Home
This home is located at 942 Marshall Ave Unit D, Saint Louis, MO 63119 and is currently estimated at $123,633, approximately $157 per square foot. 942 Marshall Ave Unit D is a home located in St. Louis County with nearby schools including Avery Elementary School, Hixson Middle School, and Webster Groves High School.
Ownership History
Date
Name
Owned For
Owner Type
Purchase Details
Closed on
Aug 25, 2005
Sold by
Hadican Thomas M and Hadican Christina A
Bought by
Hadican Thomas M and Hadican Christina A
Current Estimated Value
Home Financials for this Owner
Home Financials are based on the most recent Mortgage that was taken out on this home.
Original Mortgage
$61,500
Outstanding Balance
$31,703
Interest Rate
5.37%
Mortgage Type
Fannie Mae Freddie Mac
Estimated Equity
$91,930
Purchase Details
Closed on
Feb 27, 2001
Sold by
Lee Thompson Martha and Thompson Toland Nancy
Bought by
King Christina
Home Financials for this Owner
Home Financials are based on the most recent Mortgage that was taken out on this home.
Original Mortgage
$62,080
Interest Rate
7.1%
Mortgage Type
FHA
Create a Home Valuation Report for This Property
The Home Valuation Report is an in-depth analysis detailing your home's value as well as a comparison with similar homes in the area
Home Values in the Area
Average Home Value in this Area
Purchase History
| Date | Buyer | Sale Price | Title Company |
|---|---|---|---|
| Hadican Thomas M | -- | Gtc | |
| King Christina | $64,000 | -- | |
| King Christina | -- | -- |
Source: Public Records
Mortgage History
| Date | Status | Borrower | Loan Amount |
|---|---|---|---|
| Open | Hadican Thomas M | $61,500 | |
| Closed | King Christina | $62,080 |
Source: Public Records
Tax History Compared to Growth
Tax History
| Year | Tax Paid | Tax Assessment Tax Assessment Total Assessment is a certain percentage of the fair market value that is determined by local assessors to be the total taxable value of land and additions on the property. | Land | Improvement |
|---|---|---|---|---|
| 2025 | $1,318 | $21,220 | $8,660 | $12,560 |
| 2024 | $1,318 | $18,390 | $4,480 | $13,910 |
| 2023 | $1,311 | $18,390 | $4,480 | $13,910 |
| 2022 | $1,242 | $16,140 | $5,970 | $10,170 |
| 2021 | $1,238 | $16,140 | $5,970 | $10,170 |
| 2020 | $1,364 | $16,630 | $5,970 | $10,660 |
| 2019 | $1,354 | $16,630 | $5,970 | $10,660 |
| 2018 | $1,556 | $17,060 | $4,100 | $12,960 |
| 2017 | $1,546 | $17,060 | $4,100 | $12,960 |
| 2016 | $1,451 | $15,360 | $3,290 | $12,070 |
| 2015 | $1,448 | $15,360 | $3,290 | $12,070 |
| 2014 | $1,321 | $13,610 | $2,550 | $11,060 |
Source: Public Records
Map
Nearby Homes
- 1016 Marshall Ave
- 874 Tuxedo Blvd
- 1048 Kuhlman Ln
- 1052 Kuhlman Ln
- 1046 Marshall Ave
- 1051 Kuhlman Ln
- 1045 Tuxedo Blvd
- 835 N Forest Ave
- 570 N Laclede Station Rd
- 554 N Laclede Station Rd
- 817 N Forest Ave
- 1088 Key Ave W
- 808 Greeley Ave
- 804 E Pacific Ave
- 544 Summit Ave
- 946 Newport Ave
- 706 Atalanta Ave
- 7723 Suffolk Ave
- 685 Clark Ave
- 3253 Walter Ave
- 934 Marshall Ave Unit C
- 934 Marshall Ave Unit D
- 942 Marshall Ave Unit C
- 942 Marshall Ave Unit A
- 938 Marshall Ave Unit B
- 942 Marshall Ave Unit B
- 934 Marshall Ave Unit B
- 938 Marshall Ave Unit C
- 938 Marshall Ave Unit A
- 938 Marshall Ave Unit D
- 934 Marshall Ave Unit A
- 930 Marshall Ave Unit A
- 926 Marshall Ave Unit D
- 930 Marshall Ave Unit C
- 926 Marshall Ave Unit B
- 930 Marshall Ave Unit B
- 926 Marshall Ave Unit C
- 926 Marshall Ave Unit A
- 946 Marshall Ave Unit C
- 946 Marshall Ave Unit D