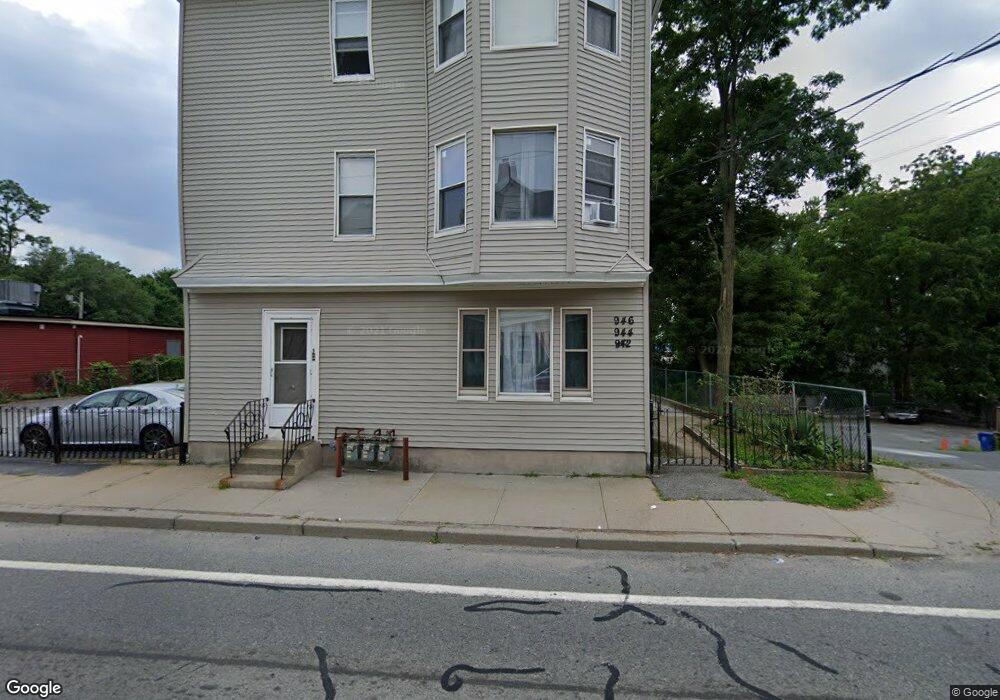
942 Mendon Rd Cumberland, RI 02864
Berkeley NeighborhoodEstimated Value: $606,000 - $700,000
7
Beds
3
Baths
3,246
Sq Ft
$196/Sq Ft
Est. Value
About This Home
This home is located at 942 Mendon Rd, Cumberland, RI 02864 and is currently estimated at $637,622, approximately $196 per square foot. 942 Mendon Rd is a home located in Providence County with nearby schools including Garvin Memorial School, Joseph L. McCourt Middle School, and Cumberland High School.
Ownership History
Date
Name
Owned For
Owner Type
Purchase Details
Closed on
Oct 25, 1990
Sold by
Acciaioli Peter C
Bought by
Lopez Marco T
Current Estimated Value
Home Financials for this Owner
Home Financials are based on the most recent Mortgage that was taken out on this home.
Original Mortgage
$144,400
Interest Rate
10.08%
Mortgage Type
Purchase Money Mortgage
Create a Home Valuation Report for This Property
The Home Valuation Report is an in-depth analysis detailing your home's value as well as a comparison with similar homes in the area
Home Values in the Area
Average Home Value in this Area
Purchase History
| Date | Buyer | Sale Price | Title Company |
|---|---|---|---|
| Lopez Marco T | $152,000 | -- |
Source: Public Records
Mortgage History
| Date | Status | Borrower | Loan Amount |
|---|---|---|---|
| Open | Lopez Marco T | $136,510 | |
| Closed | Lopez Marco T | $144,400 |
Source: Public Records
Tax History
| Year | Tax Paid | Tax Assessment Tax Assessment Total Assessment is a certain percentage of the fair market value that is determined by local assessors to be the total taxable value of land and additions on the property. | Land | Improvement |
|---|---|---|---|---|
| 2025 | $4,991 | $406,800 | $105,200 | $301,600 |
| 2024 | $4,861 | $406,800 | $105,200 | $301,600 |
| 2023 | $4,727 | $406,800 | $105,200 | $301,600 |
| 2022 | $3,933 | $262,400 | $69,600 | $192,800 |
| 2021 | $3,868 | $262,400 | $69,600 | $192,800 |
| 2020 | $3,758 | $262,400 | $69,600 | $192,800 |
| 2019 | $3,206 | $201,900 | $51,900 | $150,000 |
| 2018 | $3,113 | $201,900 | $51,900 | $150,000 |
| 2017 | $3,071 | $201,900 | $51,900 | $150,000 |
| 2016 | $3,305 | $193,500 | $58,500 | $135,000 |
| 2015 | $3,305 | $193,500 | $58,500 | $135,000 |
| 2014 | $3,305 | $193,500 | $58,500 | $135,000 |
| 2013 | $3,134 | $198,600 | $61,700 | $136,900 |
Source: Public Records
Map
Nearby Homes
- 3 Barrett St
- 21 A St
- 200 Old Mendon Rd
- 1251 Mendon Rd
- 1 Barway Ln
- 473 River Rd
- 1 Ashley Dr
- 34 Dexter Rock Rd
- 7 Hidden Valley Ln
- 8 Dorr St
- 0 Narragansett Rd
- 24 Narragansett Ave
- 27 Norman St
- 98 Iroquois Rd
- 18 Narragansett Ave
- 97 Angell Rd
- 1037 Great Rd
- 11 Woodside Ave
- 107 Old River Rd Unit 11
- 163 Woodside Ave
Your Personal Tour Guide
Ask me questions while you tour the home.