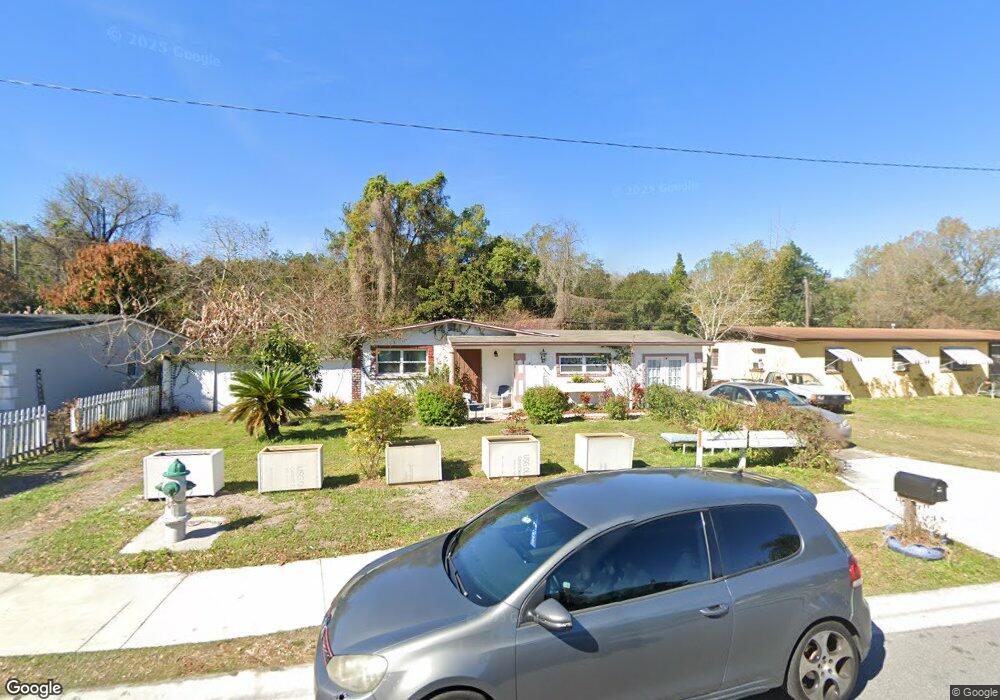
942 Murdock Blvd Orlando, FL 32825
Estimated Value: $233,000 - $323,000
3
Beds
1
Bath
1,087
Sq Ft
$266/Sq Ft
Est. Value
About This Home
This home is located at 942 Murdock Blvd, Orlando, FL 32825 and is currently estimated at $289,364, approximately $266 per square foot. 942 Murdock Blvd is a home located in Orange County with nearby schools including Lawton Chiles Elementary School, Union Park Middle School, and University High School.
Ownership History
Date
Name
Owned For
Owner Type
Purchase Details
Closed on
May 18, 2024
Sold by
Espino Jose Santos and Espino Yanes Narda
Bought by
Espino Jose Santos and De Santos Yanes
Current Estimated Value
Purchase Details
Closed on
Sep 12, 2008
Sold by
Sanchez Florencio
Bought by
Sanchez Florencio and Espino Jose Santos
Purchase Details
Closed on
Jan 10, 2003
Sold by
Perez Carmon A Rodriguez
Bought by
Sanchez Florencio and Sanchez Maria
Home Financials for this Owner
Home Financials are based on the most recent Mortgage that was taken out on this home.
Original Mortgage
$70,644
Interest Rate
5.98%
Mortgage Type
FHA
Purchase Details
Closed on
Apr 18, 2000
Sold by
Pr Donna L Hassett and Wendell Deborah A
Bought by
Perez Carmon A R
Home Financials for this Owner
Home Financials are based on the most recent Mortgage that was taken out on this home.
Original Mortgage
$50,400
Interest Rate
8.29%
Mortgage Type
New Conventional
Create a Home Valuation Report for This Property
The Home Valuation Report is an in-depth analysis detailing your home's value as well as a comparison with similar homes in the area
Home Values in the Area
Average Home Value in this Area
Purchase History
| Date | Buyer | Sale Price | Title Company |
|---|---|---|---|
| Espino Jose Santos | $100 | None Listed On Document | |
| Sanchez Florencio | $37,200 | None Available | |
| Sanchez Florencio | $87,000 | Fidelity National Title Insu | |
| Perez Carmon A R | $10,500 | -- |
Source: Public Records
Mortgage History
| Date | Status | Borrower | Loan Amount |
|---|---|---|---|
| Previous Owner | Sanchez Florencio | $70,644 | |
| Previous Owner | Perez Carmon A R | $50,400 |
Source: Public Records
Tax History Compared to Growth
Tax History
| Year | Tax Paid | Tax Assessment Tax Assessment Total Assessment is a certain percentage of the fair market value that is determined by local assessors to be the total taxable value of land and additions on the property. | Land | Improvement |
|---|---|---|---|---|
| 2025 | $3,520 | $241,180 | $83,000 | $158,180 |
| 2024 | $3,003 | $190,057 | -- | -- |
| 2023 | $3,003 | $195,782 | $83,000 | $112,782 |
| 2022 | $2,720 | $175,817 | $80,000 | $95,817 |
| 2021 | $2,431 | $144,242 | $67,000 | $77,242 |
| 2020 | $2,174 | $133,629 | $55,000 | $78,629 |
| 2019 | $2,110 | $122,846 | $45,000 | $77,846 |
| 2018 | $1,963 | $111,433 | $42,000 | $69,433 |
| 2017 | $1,719 | $88,664 | $31,250 | $57,414 |
| 2016 | $1,625 | $84,276 | $28,000 | $56,276 |
| 2015 | $1,583 | $83,112 | $28,000 | $55,112 |
| 2014 | $1,534 | $77,911 | $30,000 | $47,911 |
Source: Public Records
Map
Nearby Homes
- 1025 Hardwick Ave
- 0 Hardwick Ave
- 1001 Buttercup Ln
- 824 Park Manor Dr
- 1142 Grayson Dr
- 1735 Grayson Dr
- 10900 Tangora St
- 10800 Fernando St
- 1206 Culver Rd
- 774 Hendrix Ave
- 748 Woodvalley Way
- 10320 Brownwood Ave
- 10833 Exuma St
- 719 Dawson Ave
- 632 Herons Nest Ct
- 0 Culver Rd
- 10557 Glassborough Dr
- 10506 Huntridge Rd
- 1615 Martinsville Ct
- 1414 Park Manor Dr
- 936 Murdock Blvd
- 948 Murdock Blvd
- 930 Murdock Blvd
- 1002 Murdock Blvd
- 10602 Crocus St
- 929 Murdock Blvd
- 924 Murdock Blvd
- 923 Murdock Blvd
- 10608 Crocus St
- 10603 Crocus St
- 1014 Murdock Blvd
- 917 Murdock Blvd
- 10614 Crocus St
- 10609 Crocus St
- 10621 Udell Ct
- 10617 Udell Ct
- 912 Murdock Blvd
- 1001 Narcissus Ln
- 1020 Murdock Blvd
- 911 Murdock Blvd