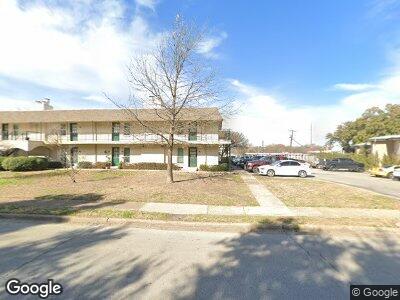
942 S Weatherred Dr Unit 942 Richardson, TX 75080
Richardson Heights NeighborhoodEstimated Value: $133,000 - $148,651
2
Beds
1
Bath
958
Sq Ft
$149/Sq Ft
Est. Value
About This Home
This home is located at 942 S Weatherred Dr Unit 942, Richardson, TX 75080 and is currently estimated at $142,663, approximately $148 per square foot. 942 S Weatherred Dr Unit 942 is a home located in Dallas County with nearby schools including Math Science Technology Magnet Elementary School, Richardson West Jr. High School, and Richardson High School.
Ownership History
Date
Name
Owned For
Owner Type
Purchase Details
Closed on
Oct 8, 2021
Sold by
Singh Jasmeeti
Bought by
Ibarra Jasus Alberto Jumenez
Current Estimated Value
Home Financials for this Owner
Home Financials are based on the most recent Mortgage that was taken out on this home.
Original Mortgage
$107,349
Outstanding Balance
$100,406
Interest Rate
2.8%
Mortgage Type
Purchase Money Mortgage
Purchase Details
Closed on
Oct 9, 2001
Sold by
Mendelson Chemene
Bought by
Singh Mandeep
Home Financials for this Owner
Home Financials are based on the most recent Mortgage that was taken out on this home.
Original Mortgage
$29,600
Interest Rate
6.85%
Mortgage Type
Purchase Money Mortgage
Purchase Details
Closed on
Sep 20, 2000
Sold by
Northgale Village Assn
Bought by
Mendelson Chemene
Purchase Details
Closed on
Jun 6, 2000
Sold by
Northgale Village Assn
Bought by
Northgale Village Assn
Create a Home Valuation Report for This Property
The Home Valuation Report is an in-depth analysis detailing your home's value as well as a comparison with similar homes in the area
Home Values in the Area
Average Home Value in this Area
Purchase History
| Date | Buyer | Sale Price | Title Company |
|---|---|---|---|
| Ibarra Jasus Alberto Jumenez | -- | Old Republic Title | |
| Singh Mandeep | -- | -- | |
| Mendelson Chemene | -- | -- |
Source: Public Records
Mortgage History
| Date | Status | Borrower | Loan Amount |
|---|---|---|---|
| Open | Ibarra Jasus Alberto Jumenez | $107,349 | |
| Closed | Ibarra Jesus Alberto Jimenez | $107,349 | |
| Previous Owner | Singh Mandeep | $29,600 |
Source: Public Records
Tax History Compared to Growth
Tax History
| Year | Tax Paid | Tax Assessment Tax Assessment Total Assessment is a certain percentage of the fair market value that is determined by local assessors to be the total taxable value of land and additions on the property. | Land | Improvement |
|---|---|---|---|---|
| 2023 | $3,085 | $124,540 | $27,560 | $96,980 |
| 2022 | $3,045 | $124,540 | $27,560 | $96,980 |
| 2021 | $2,261 | $86,220 | $27,560 | $58,660 |
| 2020 | $2,302 | $86,220 | $27,560 | $58,660 |
| 2019 | $2,416 | $86,220 | $27,560 | $58,660 |
| 2018 | $1,024 | $38,320 | $9,190 | $29,130 |
| 2017 | $1,023 | $38,320 | $9,190 | $29,130 |
| 2016 | $895 | $33,530 | $9,190 | $24,340 |
| 2015 | $885 | $33,530 | $9,190 | $24,340 |
| 2014 | $885 | $33,530 | $9,190 | $24,340 |
Source: Public Records
Map
Nearby Homes
- 962 S Weatherred Dr Unit 962
- 919 S Weatherred Dr Unit 211C
- 919 S Weatherred Dr Unit 140G
- 919 S Weatherred Dr Unit 113C
- 919 S Weatherred Dr Unit 108B
- 919 S Weatherred Dr Unit 127E
- 919 S Weatherred Dr Unit 153H
- 919 S Weatherred Dr Unit 212C
- 919 S Weatherred Dr Unit 152H
- 919 S Weatherred Dr Unit 219D
- 919 S Weatherred Dr Unit 205B
- 921 Blue Lake Cir
- 717 Cliffside Dr
- 946 Blue Lake Cir
- 812 Bristol Ct
- 1200 Ridgeway Dr
- 721 James Dr
- 1207 Dearborn Dr
- 706 S Waterview Dr
- 1208 Dearborn Dr
- 942 S Weatherred Dr Unit 942
- 938 S Weatherred Dr Unit 938
- 944 S Weatherred Dr Unit 944
- 946 S Weatherred Dr Unit 946
- 926 S Weatherred Dr Unit 926
- 940 S Weatherred Dr Unit 940
- 926 S Weatherred Dr
- 940 S Weatherred Dr Unit 940
- 940 S Weatherred Dr
- 926 S Weatherred Dr Unit 11B
- 936 S Weatherred Dr Unit 936
- 936 S Weatherred Dr Unit 936
- 936 S Weatherred Dr Unit 986-C
- 922 S Weatherred Dr Unit 922
- 922 S Weatherred Dr Unit 922
- 932 S Weatherred Dr Unit 932
- 932 S Weatherred Dr Unit 932
- 920 S Weatherred Dr Unit 920
- 946 S Weatherred Dr
- 924 S Weatherred Dr Unit 924