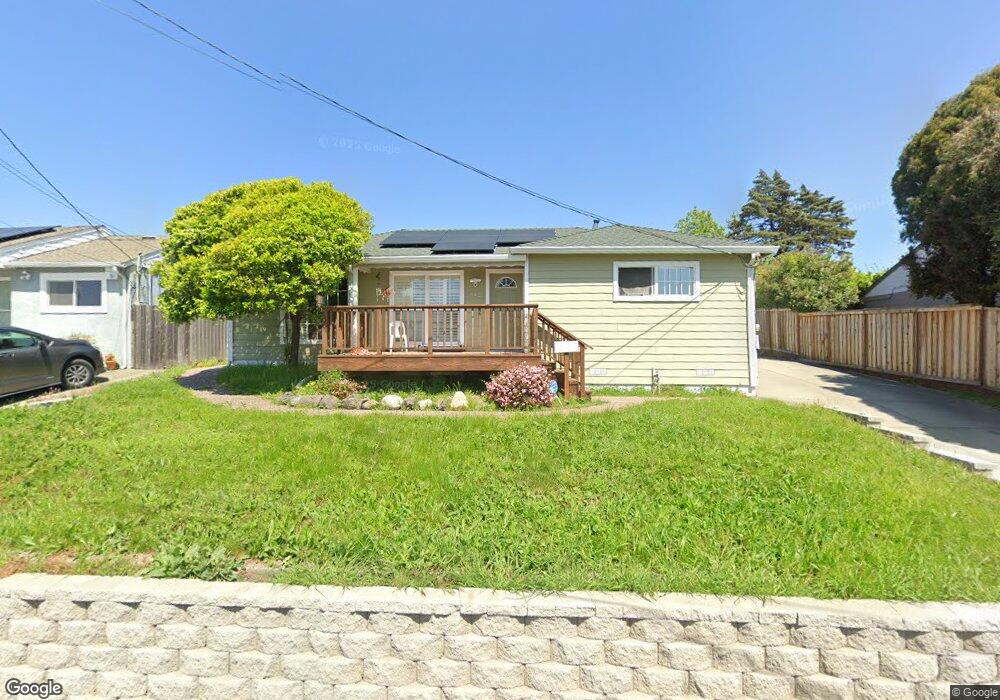
942 Saint Andrews Dr El Sobrante, CA 94803
El Sobrante Manor NeighborhoodEstimated Value: $580,791 - $692,000
2
Beds
1
Bath
1,071
Sq Ft
$586/Sq Ft
Est. Value
About This Home
This home is located at 942 Saint Andrews Dr, El Sobrante, CA 94803 and is currently estimated at $627,948, approximately $586 per square foot. 942 Saint Andrews Dr is a home located in Contra Costa County with nearby schools including Murphy Elementary School, Betty Reid Soskin Middle School, and De Anza Senior High School.
Ownership History
Date
Name
Owned For
Owner Type
Purchase Details
Closed on
Mar 8, 2002
Sold by
Smith Kiersten R
Bought by
Smith Robert W
Current Estimated Value
Home Financials for this Owner
Home Financials are based on the most recent Mortgage that was taken out on this home.
Original Mortgage
$193,000
Outstanding Balance
$80,734
Interest Rate
7.08%
Mortgage Type
Purchase Money Mortgage
Estimated Equity
$547,214
Purchase Details
Closed on
Sep 18, 1997
Sold by
Smith Robert W and Smith Kiersten R
Bought by
Smith Robert W and Smith Kiersten R
Home Financials for this Owner
Home Financials are based on the most recent Mortgage that was taken out on this home.
Original Mortgage
$127,912
Interest Rate
7.54%
Mortgage Type
FHA
Purchase Details
Closed on
Nov 18, 1993
Sold by
Young Paul Frederick and Young Grace A
Bought by
Smith Robert W
Home Financials for this Owner
Home Financials are based on the most recent Mortgage that was taken out on this home.
Original Mortgage
$133,385
Interest Rate
6.74%
Mortgage Type
FHA
Create a Home Valuation Report for This Property
The Home Valuation Report is an in-depth analysis detailing your home's value as well as a comparison with similar homes in the area
Home Values in the Area
Average Home Value in this Area
Purchase History
| Date | Buyer | Sale Price | Title Company |
|---|---|---|---|
| Smith Robert W | -- | Placer Title Company | |
| Smith Robert W | -- | Fidelity National Title Co | |
| Smith Robert W | $140,000 | Chicago Title Company |
Source: Public Records
Mortgage History
| Date | Status | Borrower | Loan Amount |
|---|---|---|---|
| Open | Smith Robert W | $193,000 | |
| Closed | Smith Robert W | $127,912 | |
| Closed | Smith Robert W | $133,385 |
Source: Public Records
Tax History Compared to Growth
Tax History
| Year | Tax Paid | Tax Assessment Tax Assessment Total Assessment is a certain percentage of the fair market value that is determined by local assessors to be the total taxable value of land and additions on the property. | Land | Improvement |
|---|---|---|---|---|
| 2025 | $4,159 | $237,922 | $163,153 | $74,769 |
| 2024 | $4,062 | $233,257 | $159,954 | $73,303 |
| 2023 | $4,062 | $228,684 | $156,818 | $71,866 |
| 2022 | $3,993 | $224,201 | $153,744 | $70,457 |
| 2021 | $3,959 | $219,806 | $150,730 | $69,076 |
| 2019 | $3,750 | $213,288 | $146,260 | $67,028 |
| 2018 | $3,593 | $209,107 | $143,393 | $65,714 |
| 2017 | $3,490 | $205,008 | $140,582 | $64,426 |
| 2016 | $3,420 | $200,989 | $137,826 | $63,163 |
| 2015 | $3,387 | $197,971 | $135,756 | $62,215 |
| 2014 | $3,360 | $194,094 | $133,097 | $60,997 |
Source: Public Records
Map
Nearby Homes
- 923 Kelvin Rd
- 1703 Dalessi Dr
- 1051 Saint Andrews Dr
- 5026 Hilltop Dr
- 12 Park Ct
- 663 Renfrew Rd
- 4778 Hilltop Dr Unit 1
- 209 N Rancho Place
- 30 Greenview Ln
- 636 Pebble Dr
- 1923 Thompson Ln
- 0 Appian Way Unit 41031165
- 742 La Paloma Rd
- 61 Homer Ct
- 1000 View Dr
- 371 Joan Vista St
- 107 Alice Ln Unit 13
- 2180 Shea Dr
- 3134 Avis Way
- 4623 Appian Way
- 958 Saint Andrews Dr
- 930 Saint Andrews Dr
- 933 Allview Ave
- 927 Allview Ave
- 970 Saint Andrews Dr
- 918 Saint Andrews Dr
- 947 Allview Ave
- 921 Allview Ave
- 945 Saint Andrews Dr
- 951 Saint Andrews Dr
- 955 Allview Ave
- 959 Saint Andrews Dr
- 974 Saint Andrews Dr
- 910 Saint Andrews Dr
- 915 Allview Ave
- 933 Saint Andrews Dr
- 963 Allview Ave
- 967 Saint Andrews Dr
- 927 Saint Andrews Dr
- 978 Saint Andrews Dr