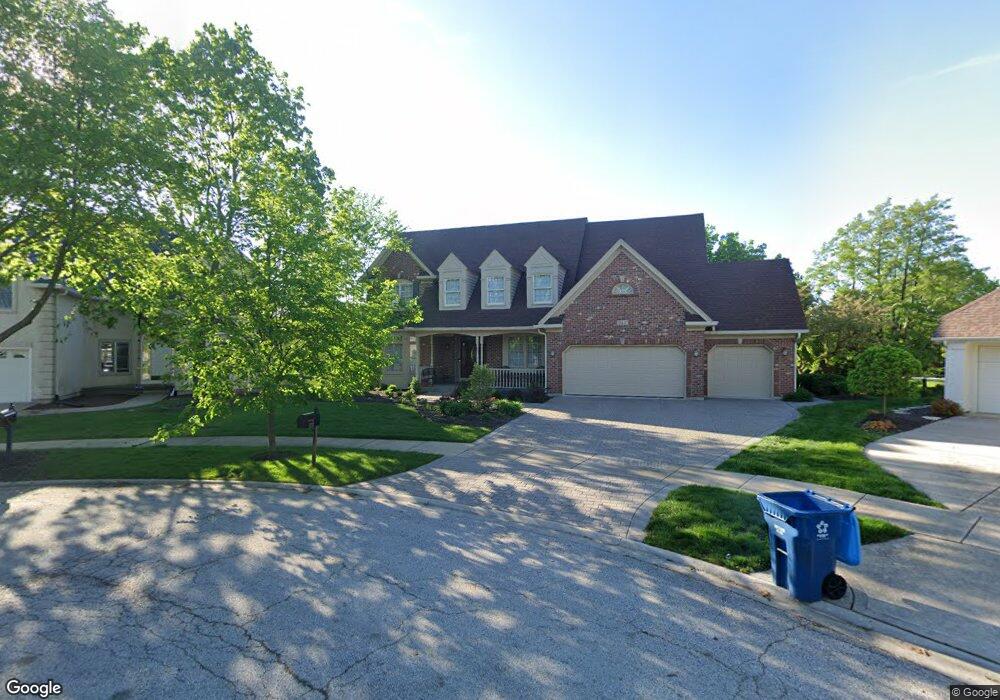
942 Waverly Ct Aurora, IL 60502
Eola Yards NeighborhoodEstimated Value: $800,000 - $990,000
4
Beds
4
Baths
3,418
Sq Ft
$259/Sq Ft
Est. Value
About This Home
This home is located at 942 Waverly Ct, Aurora, IL 60502 and is currently estimated at $885,660, approximately $259 per square foot. 942 Waverly Ct is a home located in DuPage County with nearby schools including Gwendolyn Brooks Elementary School, Francis Granger Middle School, and Metea Valley High School.
Ownership History
Date
Name
Owned For
Owner Type
Purchase Details
Closed on
Aug 9, 2013
Sold by
Moore Winifred
Bought by
Winifred Moore Trust
Current Estimated Value
Purchase Details
Closed on
Nov 1, 1999
Sold by
Tatum Edward F and Tatum Patricia A
Bought by
Moore Joseph and Moore Winifred
Home Financials for this Owner
Home Financials are based on the most recent Mortgage that was taken out on this home.
Original Mortgage
$433,800
Outstanding Balance
$131,119
Interest Rate
7.62%
Estimated Equity
$754,541
Purchase Details
Closed on
Apr 28, 1997
Sold by
Durboraw Geoffrey D and Durboraw Saundra L
Bought by
Tatum Edward F and Tatum Patricia A
Purchase Details
Closed on
Jul 11, 1994
Sold by
Kings Court Builders Inc
Bought by
Duboraw Geoffrey D and Durboraw Saundra L
Home Financials for this Owner
Home Financials are based on the most recent Mortgage that was taken out on this home.
Original Mortgage
$386,100
Interest Rate
6.5%
Create a Home Valuation Report for This Property
The Home Valuation Report is an in-depth analysis detailing your home's value as well as a comparison with similar homes in the area
Home Values in the Area
Average Home Value in this Area
Purchase History
| Date | Buyer | Sale Price | Title Company |
|---|---|---|---|
| Winifred Moore Trust | -- | First American Title Ins Co | |
| Moore Joseph | $482,000 | Law Title Pick Up | |
| Tatum Edward F | $414,000 | Law Title | |
| Duboraw Geoffrey D | $429,000 | -- |
Source: Public Records
Mortgage History
| Date | Status | Borrower | Loan Amount |
|---|---|---|---|
| Open | Moore Joseph | $433,800 | |
| Previous Owner | Duboraw Geoffrey D | $386,100 |
Source: Public Records
Tax History
| Year | Tax Paid | Tax Assessment Tax Assessment Total Assessment is a certain percentage of the fair market value that is determined by local assessors to be the total taxable value of land and additions on the property. | Land | Improvement |
|---|---|---|---|---|
| 2024 | $17,634 | $247,921 | $59,373 | $188,548 |
| 2023 | $16,804 | $222,770 | $53,350 | $169,420 |
| 2022 | $16,030 | $202,150 | $48,010 | $154,140 |
| 2021 | $15,604 | $194,940 | $46,300 | $148,640 |
| 2020 | $15,795 | $194,940 | $46,300 | $148,640 |
| 2019 | $15,236 | $185,410 | $44,040 | $141,370 |
| 2018 | $16,440 | $197,130 | $45,930 | $151,200 |
| 2017 | $16,167 | $190,440 | $44,370 | $146,070 |
| 2016 | $15,881 | $182,760 | $42,580 | $140,180 |
| 2015 | $15,722 | $173,530 | $40,430 | $133,100 |
| 2014 | $16,386 | $175,460 | $40,900 | $134,560 |
| 2013 | $16,216 | $176,670 | $41,180 | $135,490 |
Source: Public Records
Map
Nearby Homes
- 1037 Parkhill Cir
- 1015 Woodview Ct
- 1176 Heathrow Ln
- 921 Parkhill Cir
- 1110 Oakhill Dr
- 2314 Reflections Dr Unit C0602
- 2752 Preserve Cir Unit 13006
- 2748 Preserve Cir Unit 13005
- 2732 Preserve Cir Unit 13001
- 2892 Preserve Cir Unit 5003
- 2888 Preserve Cir Unit 5002
- 322 4th St
- 1771 Briarheath Dr
- 1223 Townes Cir Unit 48
- 2428 Ridgewood Ct
- 2700 Harlstone Dr Unit 53
- 1671 Sheffer Rd
- 6S371 Old Eola Rd
- 452 Jamestown Ct Unit 506
- 416 Jamestown Ct Unit 304
- 932 Waverly Ct
- 943 Waverly Ct
- 922 Waverly Ct
- 933 Waverly Ct Unit 47A
- 923 Waverly Ct Unit 47A
- 912 Waverly Ct Unit 47A
- 902 Waverly Ct
- 2360 Sutton Ln
- 2395 Lansburgh Ct
- 2372 Sutton Ln
- 913 Waverly Ct
- 892 Waverly Ct
- 2384 Sutton Ln
- 2396 Sutton Ln
- 2387 Lansburgh Ct
- 903 Waverly Ct
- 960 Waterside Ct
- 2400 Lansburgh Ct Unit 47A
- 2420 Sutton Ln
- 2348 Sutton Ln Unit 47A
Your Personal Tour Guide
Ask me questions while you tour the home.