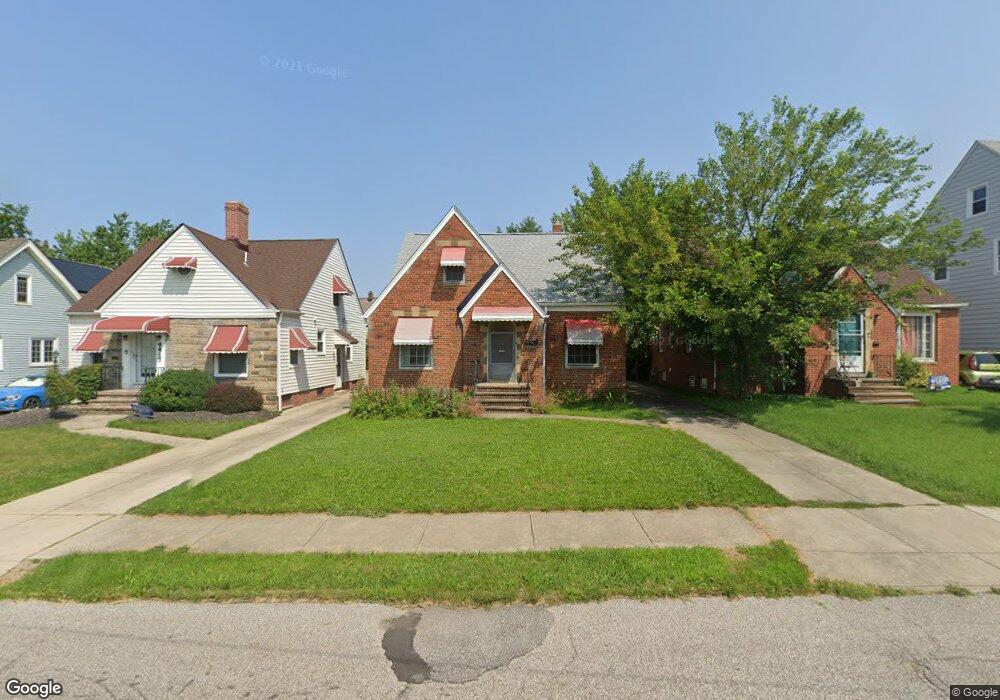
9421 Bohning Dr Cleveland, OH 44125
Estimated Value: $117,194 - $178,000
3
Beds
2
Baths
1,433
Sq Ft
$100/Sq Ft
Est. Value
About This Home
This home is located at 9421 Bohning Dr, Cleveland, OH 44125 and is currently estimated at $143,799, approximately $100 per square foot. 9421 Bohning Dr is a home located in Cuyahoga County with nearby schools including Garfield Heights High School, North Shore High School, and Holy Name Elementary School.
Ownership History
Date
Name
Owned For
Owner Type
Purchase Details
Closed on
Aug 11, 2004
Sold by
Witowski Dorothy and Roth John
Bought by
Alcorn Benjamin W
Current Estimated Value
Home Financials for this Owner
Home Financials are based on the most recent Mortgage that was taken out on this home.
Original Mortgage
$87,200
Outstanding Balance
$44,242
Interest Rate
6.35%
Mortgage Type
Purchase Money Mortgage
Estimated Equity
$99,557
Purchase Details
Closed on
Jul 1, 2000
Sold by
Witowski Stanley B
Bought by
Witowski Dorothy
Purchase Details
Closed on
Sep 1, 1998
Sold by
Markuszka Jennie
Bought by
Witowski Stanley B
Home Financials for this Owner
Home Financials are based on the most recent Mortgage that was taken out on this home.
Original Mortgage
$71,400
Interest Rate
7.06%
Purchase Details
Closed on
Dec 8, 1988
Sold by
Markuszka Edward M and Markuszka Jennie
Bought by
Markuszka Jennie
Purchase Details
Closed on
Jan 1, 1975
Bought by
Markuszka Edward M and Markuszka Jennie
Create a Home Valuation Report for This Property
The Home Valuation Report is an in-depth analysis detailing your home's value as well as a comparison with similar homes in the area
Home Values in the Area
Average Home Value in this Area
Purchase History
| Date | Buyer | Sale Price | Title Company |
|---|---|---|---|
| Alcorn Benjamin W | $109,000 | Midland Title Agency | |
| Witowski Dorothy | -- | General Title Agency | |
| Witowski Stanley B | $89,200 | City Title Company Agency In | |
| Markuszka Jennie | -- | -- | |
| Markuszka Edward M | -- | -- |
Source: Public Records
Mortgage History
| Date | Status | Borrower | Loan Amount |
|---|---|---|---|
| Open | Alcorn Benjamin W | $87,200 | |
| Previous Owner | Witowski Stanley B | $71,400 | |
| Closed | Alcorn Benjamin W | $15,800 |
Source: Public Records
Tax History Compared to Growth
Tax History
| Year | Tax Paid | Tax Assessment Tax Assessment Total Assessment is a certain percentage of the fair market value that is determined by local assessors to be the total taxable value of land and additions on the property. | Land | Improvement |
|---|---|---|---|---|
| 2024 | $4,418 | $43,540 | $7,805 | $35,735 |
| 2023 | $3,077 | $27,690 | $5,290 | $22,400 |
| 2022 | $3,034 | $27,690 | $5,290 | $22,400 |
| 2021 | $3,168 | $27,340 | $5,290 | $22,050 |
| 2020 | $2,724 | $21,880 | $4,240 | $17,640 |
| 2019 | $2,700 | $62,500 | $12,100 | $50,400 |
| 2018 | $2,810 | $21,880 | $4,240 | $17,640 |
| 2017 | $2,643 | $20,030 | $3,400 | $16,630 |
| 2016 | $2,681 | $20,030 | $3,400 | $16,630 |
| 2015 | $2,951 | $20,030 | $3,400 | $16,630 |
| 2014 | $2,951 | $24,430 | $4,130 | $20,300 |
Source: Public Records
Map
Nearby Homes
- 9507 Bohning Dr
- 9412 Grand Division Ave
- 9435 Dorothy Ave
- 9500 Cardwell Ave
- 9005 Grand Division Ave
- 9722 Robinson Ave
- 4729 E 90th St
- 4684 E 88th St
- 4769 E 90th St
- 4646 E 86th St
- 4762 E 90th St
- 10000 Greenview Ave
- 4695 E 85th St
- 10105 Greenview Ave
- 4864 E 96th St
- 10201 Greenview Ave
- 10204 Parkview Ave
- 4859 E 97th St
- 8713 Vineyard Ave
- 10217 Parkview Ave
- 9417 Bohning Dr
- 9425 Bohning Dr
- 9413 Bohning Dr
- 9503 Bohning Dr
- 4655 E 94th St
- 4655 E 94th St Unit E
- 9409 Bohning Dr
- 9405 Bohning Dr
- 4653 E 94th St
- 9418 Bohning Dr
- 9511 Bohning Dr
- 9426 Bohning Dr
- 9414 Bohning Dr
- 9504 Bohning Dr
- 9410 Bohning Dr
- 9401 Bohning Dr
- 9418 Sladden Ave
- 4647 E 94th St
- 9508 Bohning Dr
- 9515 Bohning Dr