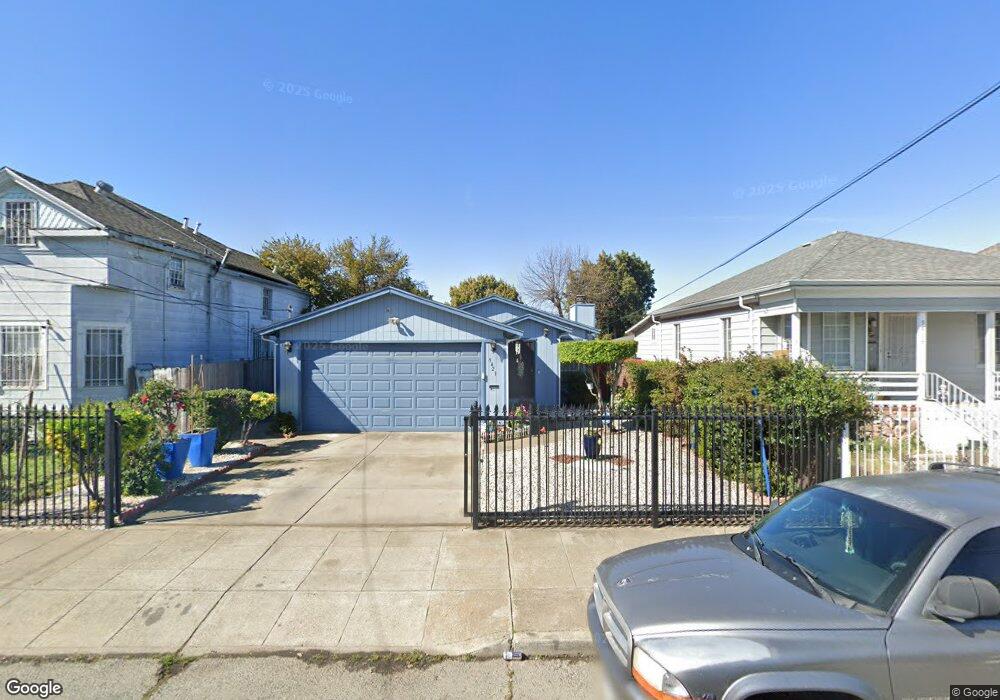
9421 D St Oakland, CA 94603
Elmhurst Park NeighborhoodEstimated Value: $526,000 - $652,000
3
Beds
2
Baths
1,336
Sq Ft
$435/Sq Ft
Est. Value
About This Home
This home is located at 9421 D St, Oakland, CA 94603 and is currently estimated at $581,073, approximately $434 per square foot. 9421 D St is a home located in Alameda County with nearby schools including Fred T. Korematsu Discovery Academy, Esperanza Elementary School, and Elmhurst United Middle School.
Ownership History
Date
Name
Owned For
Owner Type
Purchase Details
Closed on
Feb 18, 2016
Sold by
Davis Edna L
Bought by
Brown Edna Davis and Brown William R
Current Estimated Value
Purchase Details
Closed on
Feb 2, 1998
Sold by
Lee Donald
Bought by
Davis Edna L
Home Financials for this Owner
Home Financials are based on the most recent Mortgage that was taken out on this home.
Original Mortgage
$132,209
Interest Rate
6.95%
Mortgage Type
FHA
Purchase Details
Closed on
Jan 30, 1998
Sold by
Moore Walter M
Bought by
Moore Edna Davis and Davis Edna L
Home Financials for this Owner
Home Financials are based on the most recent Mortgage that was taken out on this home.
Original Mortgage
$132,209
Interest Rate
6.95%
Mortgage Type
FHA
Purchase Details
Closed on
Sep 22, 1997
Sold by
Lee Archie E and Lee Diane
Bought by
Lee Donald
Purchase Details
Closed on
Dec 13, 1995
Sold by
Lee Matricia
Bought by
Lee Archie E
Create a Home Valuation Report for This Property
The Home Valuation Report is an in-depth analysis detailing your home's value as well as a comparison with similar homes in the area
Home Values in the Area
Average Home Value in this Area
Purchase History
| Date | Buyer | Sale Price | Title Company |
|---|---|---|---|
| Brown Edna Davis | -- | None Available | |
| Davis Edna L | $133,000 | Commonwealth Land Title Co | |
| Moore Edna Davis | -- | Commonwealth Land Title Co | |
| Lee Donald | -- | -- | |
| Lee Archie E | -- | -- |
Source: Public Records
Mortgage History
| Date | Status | Borrower | Loan Amount |
|---|---|---|---|
| Previous Owner | Davis Edna L | $132,209 |
Source: Public Records
Tax History
| Year | Tax Paid | Tax Assessment Tax Assessment Total Assessment is a certain percentage of the fair market value that is determined by local assessors to be the total taxable value of land and additions on the property. | Land | Improvement |
|---|---|---|---|---|
| 2025 | $4,374 | $205,356 | $63,707 | $148,649 |
| 2024 | $4,374 | $201,193 | $62,458 | $145,735 |
| 2023 | $4,492 | $204,111 | $61,233 | $142,878 |
| 2022 | $4,317 | $193,110 | $60,033 | $140,077 |
| 2021 | $4,006 | $189,186 | $58,856 | $137,330 |
| 2020 | $3,959 | $194,175 | $58,252 | $135,923 |
| 2019 | $3,733 | $190,368 | $57,110 | $133,258 |
| 2018 | $3,657 | $186,637 | $55,991 | $130,646 |
| 2017 | $3,488 | $182,978 | $54,893 | $128,085 |
| 2016 | $3,299 | $179,391 | $53,817 | $125,574 |
| 2015 | $3,277 | $176,697 | $53,009 | $123,688 |
| 2014 | $3,225 | $173,235 | $51,970 | $121,265 |
Source: Public Records
Map
Nearby Homes
Your Personal Tour Guide
Ask me questions while you tour the home.