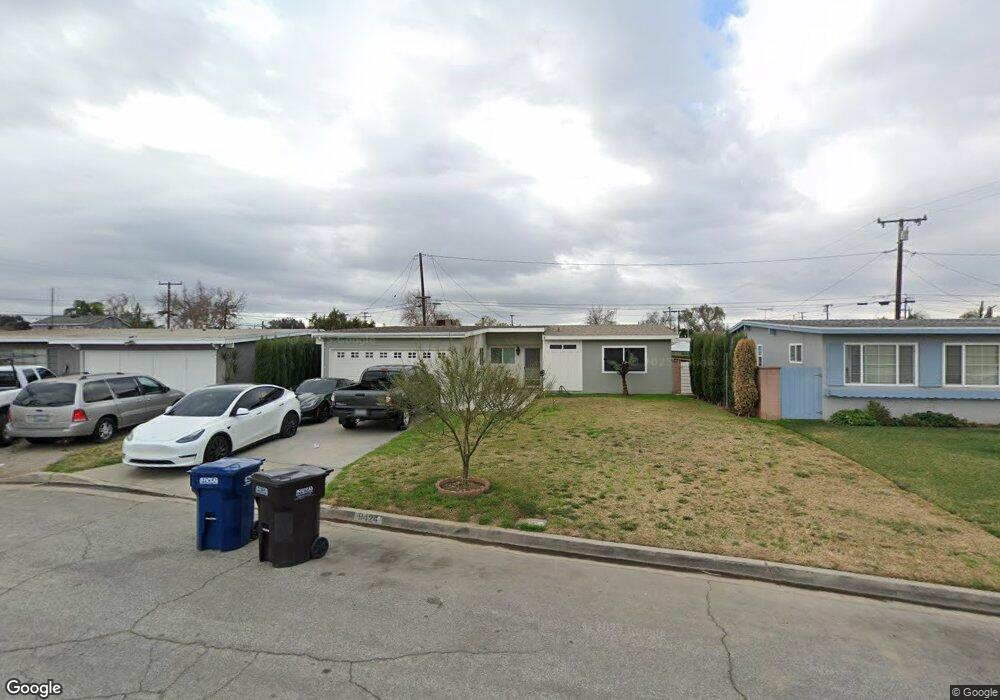
9424 Call St Pico Rivera, CA 90660
Estimated Value: $712,000 - $752,271
4
Beds
2
Baths
1,234
Sq Ft
$592/Sq Ft
Est. Value
About This Home
This home is located at 9424 Call St, Pico Rivera, CA 90660 and is currently estimated at $730,068, approximately $591 per square foot. 9424 Call St is a home located in Los Angeles County with nearby schools including Rivera Elementary School, El Rancho High School, and Ruben Salazar Continuation School.
Ownership History
Date
Name
Owned For
Owner Type
Purchase Details
Closed on
Jun 24, 2013
Sold by
Real Jose A
Bought by
Real Jose A and Real Christopher
Current Estimated Value
Purchase Details
Closed on
Jan 14, 2008
Sold by
Robbins Allen L and Robbins Family Trust
Bought by
Real Jose A
Home Financials for this Owner
Home Financials are based on the most recent Mortgage that was taken out on this home.
Original Mortgage
$235,000
Outstanding Balance
$146,967
Interest Rate
6.07%
Mortgage Type
Purchase Money Mortgage
Estimated Equity
$583,101
Purchase Details
Closed on
Jun 5, 2004
Sold by
Robbins Robert E and Robbins Family Trust
Bought by
Robbins Allen L and Robbins Family Trust
Purchase Details
Closed on
Jan 16, 2002
Sold by
Robbins Robert E and Robbins Flora L
Bought by
Robbins Robert E
Create a Home Valuation Report for This Property
The Home Valuation Report is an in-depth analysis detailing your home's value as well as a comparison with similar homes in the area
Home Values in the Area
Average Home Value in this Area
Purchase History
| Date | Buyer | Sale Price | Title Company |
|---|---|---|---|
| Real Jose A | -- | None Available | |
| Real Jose A | $375,000 | Chicago | |
| Robbins Allen L | -- | -- | |
| Robbins Robert E | -- | -- |
Source: Public Records
Mortgage History
| Date | Status | Borrower | Loan Amount |
|---|---|---|---|
| Open | Real Jose A | $235,000 |
Source: Public Records
Tax History
| Year | Tax Paid | Tax Assessment Tax Assessment Total Assessment is a certain percentage of the fair market value that is determined by local assessors to be the total taxable value of land and additions on the property. | Land | Improvement |
|---|---|---|---|---|
| 2025 | $6,802 | $492,553 | $380,913 | $111,640 |
| 2024 | $6,802 | $482,896 | $373,445 | $109,451 |
| 2023 | $6,614 | $473,428 | $366,123 | $107,305 |
| 2022 | $6,314 | $464,146 | $358,945 | $105,201 |
| 2021 | $6,181 | $455,046 | $351,907 | $103,139 |
| 2019 | $6,152 | $441,551 | $341,470 | $100,081 |
| 2018 | $5,893 | $432,894 | $334,775 | $98,119 |
| 2016 | $5,315 | $416,086 | $321,776 | $94,310 |
| 2015 | $5,235 | $409,837 | $316,943 | $92,894 |
| 2014 | $5,134 | $399,000 | $309,000 | $90,000 |
Source: Public Records
Map
Nearby Homes
- 9522 Bascom St
- 7679 Sunflower Dr
- 7686 Sunflower Dr
- 7705 Sage Dr
- 9213 Call St
- 9346 Canford St
- 7128 Farmland Ave
- 9273 Sierra Vista Cir
- 7422 Bequette Ave
- 7021 Passons Blvd
- 7019 Passons Blvd
- 9515 Shade Ln
- 8905 Warvale St
- 8104 Arrington Ave
- 8328 Buhman Ave
- 8320 Orange Ave
- 7840 Pioneer Blvd
- 7808 Pioneer Blvd
- 9734 Terradell St
- 8414 Cravell Ave
Your Personal Tour Guide
Ask me questions while you tour the home.