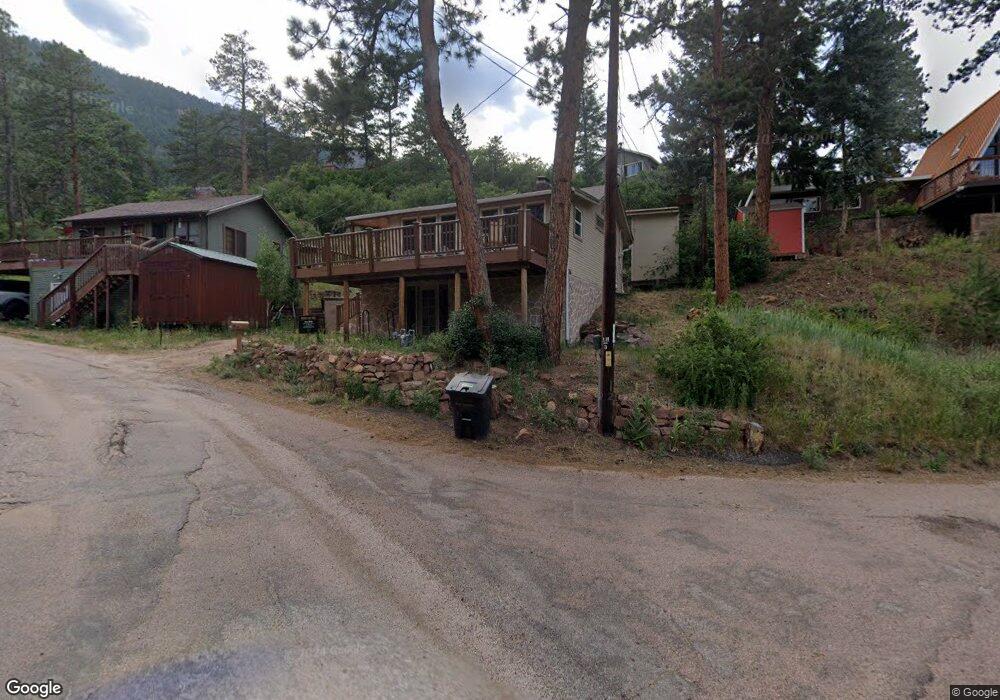
9425 Mohawk Trail Cascade, CO 80809
Cascade-Chipita Park NeighborhoodEstimated Value: $420,000 - $575,000
3
Beds
3
Baths
1,565
Sq Ft
$319/Sq Ft
Est. Value
About This Home
This home is located at 9425 Mohawk Trail, Cascade, CO 80809 and is currently estimated at $498,458, approximately $318 per square foot. 9425 Mohawk Trail is a home located in El Paso County with nearby schools including Ute Pass Elementary School, Manitou Springs Middle School, and Manitou Springs High School.
Ownership History
Date
Name
Owned For
Owner Type
Purchase Details
Closed on
Aug 29, 2005
Sold by
Brouwers Amara and Brouwers Brenda
Bought by
Serafin Mary Joan
Current Estimated Value
Home Financials for this Owner
Home Financials are based on the most recent Mortgage that was taken out on this home.
Original Mortgage
$160,000
Outstanding Balance
$85,224
Interest Rate
5.78%
Mortgage Type
Fannie Mae Freddie Mac
Estimated Equity
$413,234
Purchase Details
Closed on
Sep 29, 1994
Sold by
Morgan Wayne B and Morgan Betty S
Bought by
Brouwers Brenda
Home Financials for this Owner
Home Financials are based on the most recent Mortgage that was taken out on this home.
Original Mortgage
$96,000
Interest Rate
8.5%
Purchase Details
Closed on
Jul 16, 1973
Bought by
Serafin Mary J
Purchase Details
Closed on
Apr 29, 1969
Bought by
Serafin Mary J
Purchase Details
Closed on
Jun 14, 1967
Bought by
Serafin Mary J
Create a Home Valuation Report for This Property
The Home Valuation Report is an in-depth analysis detailing your home's value as well as a comparison with similar homes in the area
Home Values in the Area
Average Home Value in this Area
Purchase History
| Date | Buyer | Sale Price | Title Company |
|---|---|---|---|
| Serafin Mary Joan | $200,000 | Security Title | |
| Brouwers Brenda | $120,000 | Security Title | |
| Serafin Mary J | -- | -- | |
| Serafin Mary J | -- | -- | |
| Serafin Mary J | -- | -- |
Source: Public Records
Mortgage History
| Date | Status | Borrower | Loan Amount |
|---|---|---|---|
| Open | Serafin Mary Joan | $160,000 | |
| Previous Owner | Brouwers Brenda | $96,000 |
Source: Public Records
Tax History
| Year | Tax Paid | Tax Assessment Tax Assessment Total Assessment is a certain percentage of the fair market value that is determined by local assessors to be the total taxable value of land and additions on the property. | Land | Improvement |
|---|---|---|---|---|
| 2025 | $2,165 | $35,550 | -- | -- |
| 2024 | $1,529 | $32,920 | $4,150 | $28,770 |
| 2023 | $1,529 | $32,920 | $4,150 | $28,770 |
| 2022 | $974 | $19,580 | $3,440 | $16,140 |
| 2021 | $1,015 | $20,140 | $3,540 | $16,600 |
| 2020 | $835 | $17,360 | $2,970 | $14,390 |
| 2019 | $880 | $17,360 | $2,970 | $14,390 |
| 2018 | $688 | $14,730 | $2,720 | $12,010 |
| 2017 | $608 | $14,730 | $2,720 | $12,010 |
| 2016 | $529 | $14,360 | $3,010 | $11,350 |
| 2015 | $1,056 | $14,360 | $3,010 | $11,350 |
| 2014 | $958 | $13,950 | $2,870 | $11,080 |
Source: Public Records
Map
Nearby Homes
- 5870 Paona Rd
- 9355 Shoshone Rd
- 9390 Mountain Rd
- 5835 Carnia Rd
- 9610 Mohawk Trail
- 9660 Fountain Rd
- 9297 Chipita Park Rd
- 9025 Picabo Rd
- 9110 Mountain Rd
- 8850 Chipita Park Rd
- 5975 Wellington Rd
- 5295 Kulsa Rd
- 5265 Kulsa Rd
- 5260 Kulsa Rd
- 6085 Wellington Rd
- 8225 W Highway 24
- 10155 Mountain Rd
- 10225 Ute Pass Ave
- 10345 Aspen St
- 6720 Spruce Ave
- 9430 Mohawk Trail
- 5885 Iriquois Trail
- 9395 Ute Rd
- 9455 Mohawk Trail
- 9355 Ute Rd
- 9460 Mohawk Trail
- 9405 Ute Rd
- 5845 Iriquois Trail
- 9410 Columbine Trail
- 9415 Ute Rd
- 9415 Ute Rd Unit SI ID1065701P
- 9415 Ute Rd Unit ID1065701P
- 9454 Mohawk Trail
- 5850 Iriquois Trail
- 5925 Paona Rd
- 9335 Ute Rd
- 9380 Otoe Path
- 9425 Ute Rd
- 9365 Mariposa Trail
- 9520 Mountain Rd
Your Personal Tour Guide
Ask me questions while you tour the home.