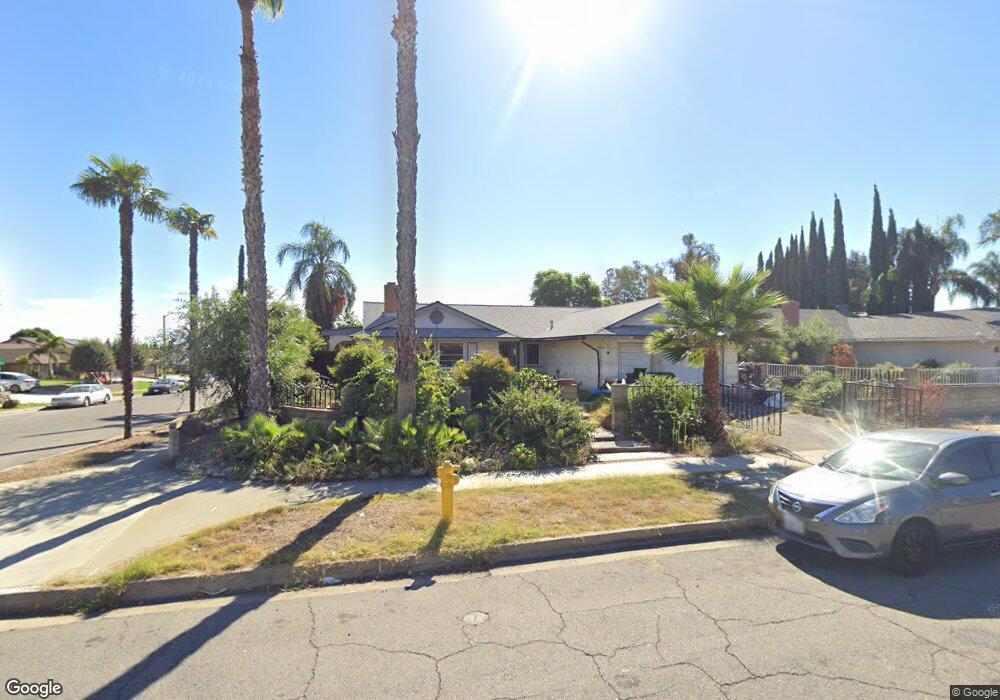
9425 Tryon St Rancho Cucamonga, CA 91730
Estimated Value: $676,323 - $747,000
4
Beds
2
Baths
1,440
Sq Ft
$497/Sq Ft
Est. Value
About This Home
This home is located at 9425 Tryon St, Rancho Cucamonga, CA 91730 and is currently estimated at $716,331, approximately $497 per square foot. 9425 Tryon St is a home located in San Bernardino County with nearby schools including Central Elementary, Cucamonga Middle, and Alta Loma High.
Ownership History
Date
Name
Owned For
Owner Type
Purchase Details
Closed on
Oct 30, 2025
Sold by
Zeffery Sandra Marie and Miramontez Sandra
Bought by
Sandra Miramontez Living Trust and Miramontez
Current Estimated Value
Purchase Details
Closed on
Jan 29, 1999
Sold by
Zeffery James M and Zeffery James Michael
Bought by
Zeffery Sandra Marie
Home Financials for this Owner
Home Financials are based on the most recent Mortgage that was taken out on this home.
Original Mortgage
$89,300
Interest Rate
6.79%
Create a Home Valuation Report for This Property
The Home Valuation Report is an in-depth analysis detailing your home's value as well as a comparison with similar homes in the area
Home Values in the Area
Average Home Value in this Area
Purchase History
| Date | Buyer | Sale Price | Title Company |
|---|---|---|---|
| Sandra Miramontez Living Trust | -- | None Listed On Document | |
| Zeffery Sandra Marie | -- | Orange Coast Title |
Source: Public Records
Mortgage History
| Date | Status | Borrower | Loan Amount |
|---|---|---|---|
| Previous Owner | Zeffery Sandra Marie | $89,300 |
Source: Public Records
Tax History Compared to Growth
Tax History
| Year | Tax Paid | Tax Assessment Tax Assessment Total Assessment is a certain percentage of the fair market value that is determined by local assessors to be the total taxable value of land and additions on the property. | Land | Improvement |
|---|---|---|---|---|
| 2025 | $3,305 | $65,431 | $11,828 | $53,603 |
| 2024 | $3,305 | $64,148 | $11,596 | $52,552 |
| 2023 | $3,289 | $62,891 | $11,369 | $51,522 |
| 2022 | $3,278 | $61,658 | $11,146 | $50,512 |
| 2021 | $3,277 | $60,449 | $10,927 | $49,522 |
| 2020 | $3,258 | $59,829 | $10,815 | $49,014 |
| 2019 | $3,254 | $58,656 | $10,603 | $48,053 |
| 2018 | $3,235 | $57,506 | $10,395 | $47,111 |
| 2017 | $3,184 | $56,378 | $10,191 | $46,187 |
| 2016 | $3,146 | $55,272 | $9,991 | $45,281 |
| 2015 | $662 | $54,442 | $9,841 | $44,601 |
| 2014 | $644 | $53,375 | $9,648 | $43,727 |
Source: Public Records
Map
Nearby Homes
- 8024 Tulsa Place
- 9471 Jack Rabbit Dr Unit 107
- 9340 Foothill Blvd Unit 68
- 9340 Foothill Blvd
- 9340 Foothill Blvd Unit 61
- 9364 Langston St
- 9599 Church St
- 7739 Lion St
- 9684 Hemlock St
- 9757 Louise Way
- 7864 Portola Rd
- 7534 Layton St
- 9442 Placer St
- 9812 Casiano Ct
- 9854 Madera Ct
- 8385 Malachite Ave
- 9880 Madera Ct
- 9464 Magnolia St
- 8244 London Ave
- 8825 Vineyard Ave