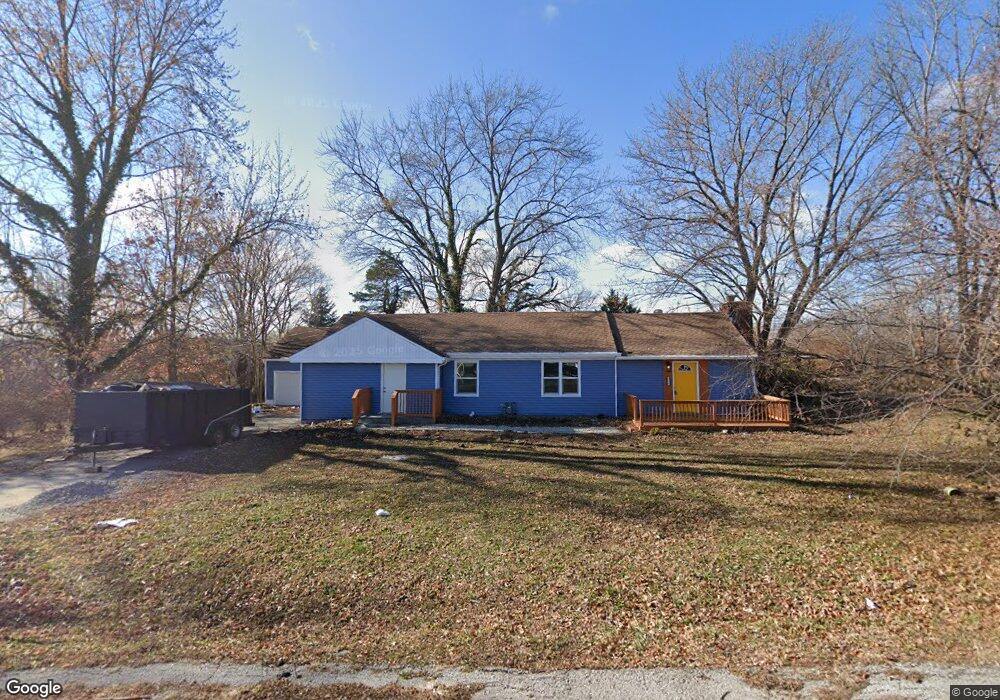
9428 NW Viewcrest St Kansas City, MO 64155
Sherrydale NeighborhoodEstimated Value: $230,000 - $279,662
3
Beds
2
Baths
1,478
Sq Ft
$173/Sq Ft
Est. Value
About This Home
This home is located at 9428 NW Viewcrest St, Kansas City, MO 64155 and is currently estimated at $256,416, approximately $173 per square foot. 9428 NW Viewcrest St is a home located in Clay County with nearby schools including Platte County High School.
Ownership History
Date
Name
Owned For
Owner Type
Purchase Details
Closed on
Feb 5, 2025
Sold by
Pros Property Management Llc
Bought by
Pearce Jeremiah
Current Estimated Value
Purchase Details
Closed on
May 3, 2024
Sold by
Llacg Community Inv Fund
Bought by
Pros Property Management Llc
Home Financials for this Owner
Home Financials are based on the most recent Mortgage that was taken out on this home.
Original Mortgage
$181,095
Interest Rate
6.87%
Mortgage Type
New Conventional
Purchase Details
Closed on
Mar 26, 2024
Sold by
Csm Foreclosure Trustee Corp
Bought by
Llacg Community Inv Fund
Home Financials for this Owner
Home Financials are based on the most recent Mortgage that was taken out on this home.
Original Mortgage
$181,095
Interest Rate
6.87%
Mortgage Type
New Conventional
Purchase Details
Closed on
Dec 5, 2011
Sold by
Gulling Michael and Gulling Linda
Bought by
Gulling Daisy N
Purchase Details
Closed on
Jun 27, 2008
Sold by
Gulling Donald and Gulling Daisy
Bought by
Gulling Don and Gulling Daisy
Create a Home Valuation Report for This Property
The Home Valuation Report is an in-depth analysis detailing your home's value as well as a comparison with similar homes in the area
Home Values in the Area
Average Home Value in this Area
Purchase History
| Date | Buyer | Sale Price | Title Company |
|---|---|---|---|
| Pearce Jeremiah | -- | Mccaffree Short Title | |
| Pearce Jeremiah | -- | Mccaffree Short Title | |
| Pros Property Management Llc | -- | Mccaffree Short Title | |
| Llacg Community Inv Fund | $152,665 | None Listed On Document | |
| Gulling Daisy N | -- | None Available | |
| Gulling Don | -- | None Available |
Source: Public Records
Mortgage History
| Date | Status | Borrower | Loan Amount |
|---|---|---|---|
| Previous Owner | Pros Property Management Llc | $181,095 |
Source: Public Records
Tax History Compared to Growth
Tax History
| Year | Tax Paid | Tax Assessment Tax Assessment Total Assessment is a certain percentage of the fair market value that is determined by local assessors to be the total taxable value of land and additions on the property. | Land | Improvement |
|---|---|---|---|---|
| 2025 | $1,845 | $28,440 | -- | -- |
| 2024 | $1,845 | $25,350 | -- | -- |
| 2023 | $1,832 | $25,350 | $0 | $0 |
| 2022 | $1,741 | $23,290 | $0 | $0 |
| 2021 | $1,750 | $23,294 | $5,700 | $17,594 |
| 2020 | $1,698 | $22,210 | $0 | $0 |
| 2019 | $1,663 | $22,210 | $0 | $0 |
| 2018 | $1,446 | $18,890 | $0 | $0 |
| 2017 | $1,436 | $18,890 | $2,850 | $16,040 |
| 2016 | $2,583 | $17,650 | $2,850 | $14,800 |
| 2015 | $1,322 | $17,650 | $2,850 | $14,800 |
| 2014 | $1,253 | $17,650 | $2,850 | $14,800 |
Source: Public Records
Map
Nearby Homes
- 9513 N Main St
- 912 NW 94th Terrace
- 3725 NE 90th Terrace
- 9621 N Locust Dr
- 1748 NW 107th Terrace
- 1012 NW 94th Terrace
- 9419 N Belleview Ave
- 612 NE 93rd Ct
- 8912 N Grand Ave
- 8915 N Grand Ave
- 1020 NW 95th Terrace
- 1024 NW 95th Terrace
- 1028 NW 95th Terrace
- 1012 NW 94th St
- 1100 NW 95th Terrace
- 9423 N Jarboe Ct
- 8828 N Main St
- 1037 NW 91st Terrace
- 400 NE 98th Terrace
- 520 NW 88th Terrace
- 9426 NW Viewcrest St
- 9458 NW Viewcrest St
- 9414 N Wyandotte St
- 9420 N Wyandotte St
- 9412 N Wyandotte St
- 9416 N Wyandotte St
- 9402 N Wyandotte St
- 9410 N Wyandotte St
- 9404 N Wyandotte St
- 9400 N Wyandotte St
- 9406 N Wyandotte St
- 9426 N Wyandotte St
- 9422 N Wyandotte St
- 9410 N Baltimore Ave
- 9420 N Baltimore Ave
- 9400 N Baltimore Ave
- 9430 N Baltimore Ave
- 9424 NW Viewcrest St
- 9424 NW View Crest Dr
- 9440 N Baltimore Ave