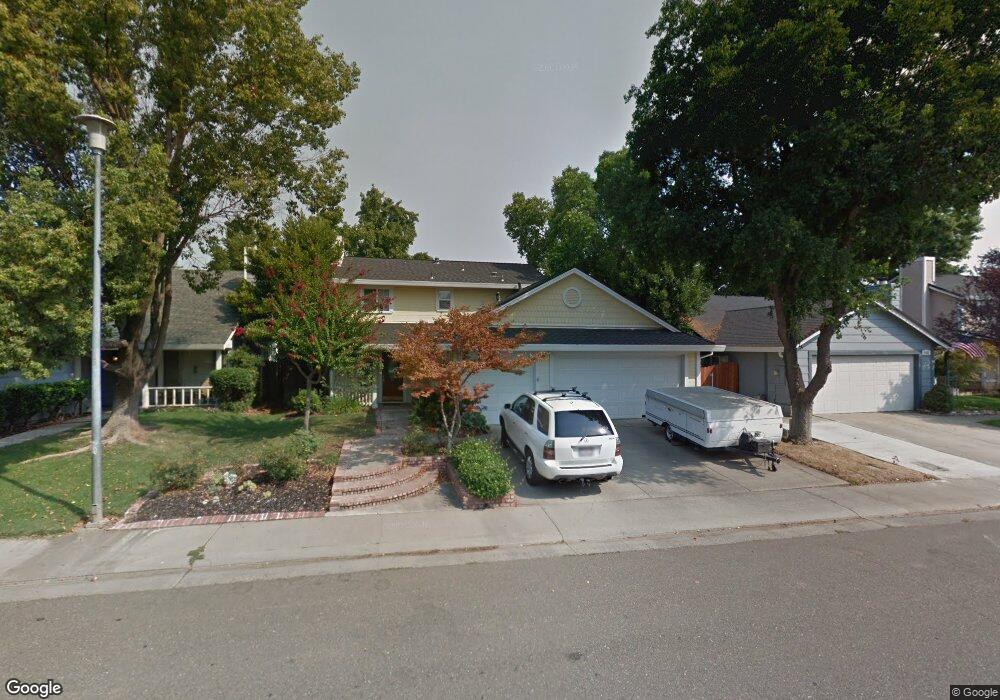
9429 Feickert Dr Elk Grove, CA 95624
North East Elk Grove NeighborhoodEstimated Value: $514,619 - $581,000
3
Beds
3
Baths
1,454
Sq Ft
$373/Sq Ft
Est. Value
About This Home
This home is located at 9429 Feickert Dr, Elk Grove, CA 95624 and is currently estimated at $542,405, approximately $373 per square foot. 9429 Feickert Dr is a home located in Sacramento County with nearby schools including Ellen Feickert Elementary School, Joseph Kerr Middle School, and Elk Grove High School.
Ownership History
Date
Name
Owned For
Owner Type
Purchase Details
Closed on
Apr 28, 2009
Sold by
Beckner Michael L and Beckner Lynette
Bought by
Beckner Michael L and Beckner Lynette
Current Estimated Value
Home Financials for this Owner
Home Financials are based on the most recent Mortgage that was taken out on this home.
Original Mortgage
$75,000
Interest Rate
4.82%
Mortgage Type
New Conventional
Purchase Details
Closed on
Jan 8, 2008
Sold by
Beckner Michael L and Beckner Lynette
Bought by
Michael L & Lynette Beckner Revocable Tr
Purchase Details
Closed on
Mar 23, 1998
Sold by
Beckner Michael L
Bought by
Beckner Michael L and Beckner Lynette
Home Financials for this Owner
Home Financials are based on the most recent Mortgage that was taken out on this home.
Original Mortgage
$138,037
Outstanding Balance
$23,003
Interest Rate
7.06%
Mortgage Type
FHA
Estimated Equity
$519,402
Purchase Details
Closed on
Dec 1, 1994
Sold by
Beckner Donald R and Beckner Pamela Teresa
Bought by
Beckner Michael L
Home Financials for this Owner
Home Financials are based on the most recent Mortgage that was taken out on this home.
Original Mortgage
$133,000
Interest Rate
9.08%
Create a Home Valuation Report for This Property
The Home Valuation Report is an in-depth analysis detailing your home's value as well as a comparison with similar homes in the area
Home Values in the Area
Average Home Value in this Area
Purchase History
| Date | Buyer | Sale Price | Title Company |
|---|---|---|---|
| Beckner Michael L | -- | First American Title | |
| Michael L & Lynette Beckner Revocable Tr | -- | None Available | |
| Beckner Michael L | -- | Chicago Title Co | |
| Beckner Michael L | $140,000 | -- | |
| Beckner Michael L | -- | -- |
Source: Public Records
Mortgage History
| Date | Status | Borrower | Loan Amount |
|---|---|---|---|
| Closed | Beckner Michael L | $75,000 | |
| Open | Beckner Michael L | $138,037 | |
| Closed | Beckner Michael L | $133,000 |
Source: Public Records
Tax History
| Year | Tax Paid | Tax Assessment Tax Assessment Total Assessment is a certain percentage of the fair market value that is determined by local assessors to be the total taxable value of land and additions on the property. | Land | Improvement |
|---|---|---|---|---|
| 2025 | $2,549 | $235,126 | $100,765 | $134,361 |
| 2024 | $2,549 | $230,517 | $98,790 | $131,727 |
| 2023 | $2,482 | $225,998 | $96,853 | $129,145 |
| 2022 | $2,434 | $221,567 | $94,954 | $126,613 |
| 2021 | $2,398 | $217,224 | $93,093 | $124,131 |
| 2020 | $2,364 | $214,998 | $92,139 | $122,859 |
| 2019 | $2,318 | $210,783 | $90,333 | $120,450 |
| 2018 | $2,254 | $206,651 | $88,562 | $118,089 |
| 2017 | $2,212 | $202,600 | $86,826 | $115,774 |
| 2016 | $2,099 | $198,628 | $85,124 | $113,504 |
| 2015 | $2,059 | $195,646 | $83,846 | $111,800 |
| 2014 | $2,024 | $191,814 | $82,204 | $109,610 |
Source: Public Records
Map
Nearby Homes
- 9342 Los Torres Dr
- 8548 Iris Crest Way
- 8772 Contemporary Ct
- 8705 Sangria Ct
- 8783 Elk Way
- 8778 Cling Ct
- 8751 Torrey Way
- 8804 On Ct
- 8770 Superb Cir
- 8845 Kelsey Dr
- 8392 Red Fox Way
- 9309 Barth St
- 8896 Kelsey Dr
- 8314 Windwood Way
- 8824 San Badger Way
- 9328 Aizenberg Cir
- 9076 Glenbury Ct
- 97 Calle Anta
- 8964 Laguna Vista Ct
- 30 Calle Susana
- 9433 Feickert Dr
- 9425 Feickert Dr
- 8608 Zircon Crest Ct
- 9437 Feickert Dr
- 8612 Zircon Crest Ct
- 8604 Zircon Crest Ct
- 9421 Feickert Dr
- 8616 Zircon Crest Ct
- 9428 Feickert Dr
- 8600 Zircon Crest Ct
- 9441 Feickert Dr
- 9432 Feickert Dr
- 9424 Feickert Dr
- 9436 Feickert Dr
- 8620 Zircon Crest Ct
- 9420 Feickert Dr
- 9445 Feickert Dr
- 9440 Feickert Dr
- 9416 Feickert Dr
- 8624 Zircon Crest Ct
Your Personal Tour Guide
Ask me questions while you tour the home.