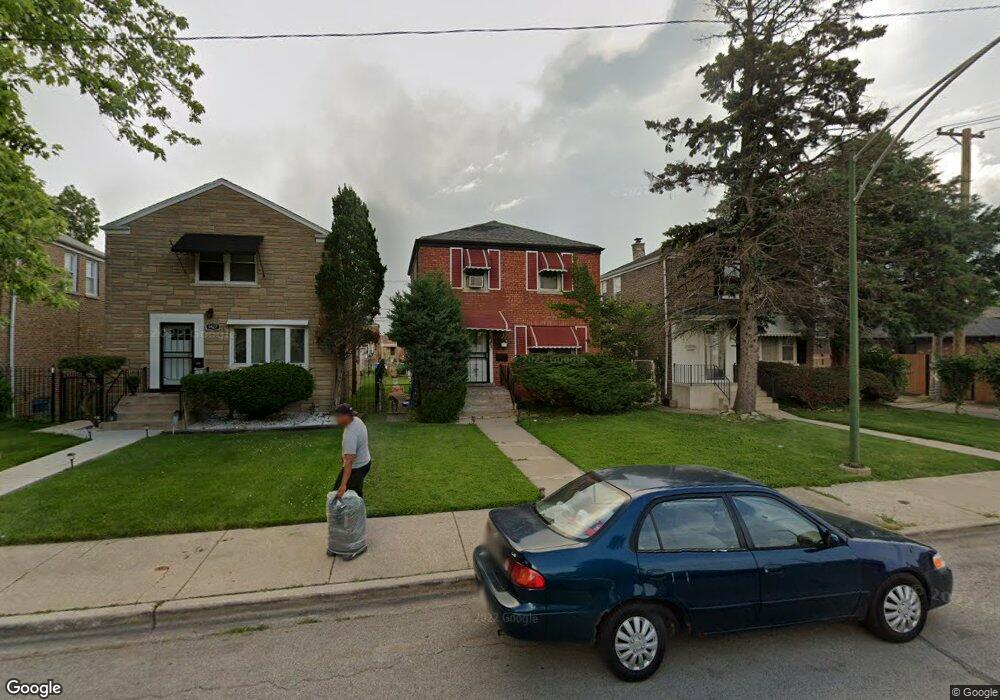
9429 S Peoria St Chicago, IL 60620
Brainerd NeighborhoodEstimated Value: $193,318 - $227,000
2
Beds
2
Baths
1,144
Sq Ft
$179/Sq Ft
Est. Value
About This Home
This home is located at 9429 S Peoria St, Chicago, IL 60620 and is currently estimated at $204,830, approximately $179 per square foot. 9429 S Peoria St is a home located in Cook County with nearby schools including Kipling Elementary School, Harlan Community Academy High School, and CICS - Longwood Campus.
Ownership History
Date
Name
Owned For
Owner Type
Purchase Details
Closed on
Aug 22, 2012
Sold by
Gray Group Ventures Llc
Bought by
Peterson Micheal
Current Estimated Value
Purchase Details
Closed on
Apr 6, 2007
Sold by
Wells Fargo Bank Na
Bought by
Graygroup Ventures Llc
Home Financials for this Owner
Home Financials are based on the most recent Mortgage that was taken out on this home.
Original Mortgage
$113,950
Interest Rate
8.25%
Mortgage Type
Unknown
Purchase Details
Closed on
Jan 30, 2007
Sold by
Robinson Gwendolyn
Bought by
Wells Fargo Bank Na
Purchase Details
Closed on
Mar 3, 2005
Sold by
West Andrea N
Bought by
Robinson Gwendolyn
Home Financials for this Owner
Home Financials are based on the most recent Mortgage that was taken out on this home.
Original Mortgage
$135,000
Interest Rate
7.25%
Mortgage Type
Unknown
Purchase Details
Closed on
Apr 16, 2004
Sold by
West Lucille Oneil
Bought by
West Andrea
Create a Home Valuation Report for This Property
The Home Valuation Report is an in-depth analysis detailing your home's value as well as a comparison with similar homes in the area
Home Values in the Area
Average Home Value in this Area
Purchase History
| Date | Buyer | Sale Price | Title Company |
|---|---|---|---|
| Peterson Micheal | $36,000 | None Available | |
| Graygroup Ventures Llc | $115,500 | First American Title | |
| Wells Fargo Bank Na | -- | None Available | |
| Robinson Gwendolyn | $135,000 | Residential Title Services | |
| West Andrea | -- | -- |
Source: Public Records
Mortgage History
| Date | Status | Borrower | Loan Amount |
|---|---|---|---|
| Previous Owner | Graygroup Ventures Llc | $113,950 | |
| Previous Owner | Robinson Gwendolyn | $135,000 |
Source: Public Records
Tax History Compared to Growth
Tax History
| Year | Tax Paid | Tax Assessment Tax Assessment Total Assessment is a certain percentage of the fair market value that is determined by local assessors to be the total taxable value of land and additions on the property. | Land | Improvement |
|---|---|---|---|---|
| 2024 | $1,586 | $11,648 | $3,753 | $7,895 |
| 2023 | $1,547 | $7,501 | $2,963 | $4,538 |
| 2022 | $1,547 | $7,501 | $2,963 | $4,538 |
| 2021 | $1,512 | $7,499 | $2,962 | $4,537 |
| 2020 | $2,980 | $13,345 | $2,962 | $10,383 |
| 2019 | $2,954 | $14,665 | $2,962 | $11,703 |
| 2018 | $2,904 | $14,665 | $2,962 | $11,703 |
| 2017 | $2,074 | $9,614 | $2,567 | $7,047 |
| 2016 | $1,930 | $9,614 | $2,567 | $7,047 |
| 2015 | $1,766 | $9,614 | $2,567 | $7,047 |
| 2014 | $1,728 | $9,291 | $2,370 | $6,921 |
| 2013 | $1,929 | $10,583 | $2,370 | $8,213 |
Source: Public Records
Map
Nearby Homes
- 9426 S Peoria St
- 9348 S Green St
- 9515 S Peoria St
- 9318 S Peoria St
- 9557 S Peoria St
- 9562 S Green St
- 9356 S Union Ave
- 9620 S Sangamon St
- 9605 S Emerald Ave
- 9215 S Green St
- 9225 S Emerald Ave
- 608 W 95th St
- 9152 S Halsted St
- 9240 S Aberdeen St
- 9417 S Racine Ave
- 9316 S May St
- 9133 S Halsted St
- 9720 S Emerald Ave
- 549 W 95th St
- 9331 S Racine Ave
- 9433 S Peoria St
- 9427 S Peoria St
- 9423 S Peoria St
- 9437 S Peoria St
- 9421 S Peoria St
- 9417 S Peoria St
- 9441 S Peoria St
- 9428 S Green St
- 9426 S Green St
- 9432 S Green St
- 9422 S Green St
- 9415 S Peoria St
- 9436 S Green St
- 9447 S Peoria St
- 9420 S Green St
- 9442 S Green St
- 9416 S Green St
- 9411 S Peoria St
- 9430 S Peoria St
- 9432 S Peoria St