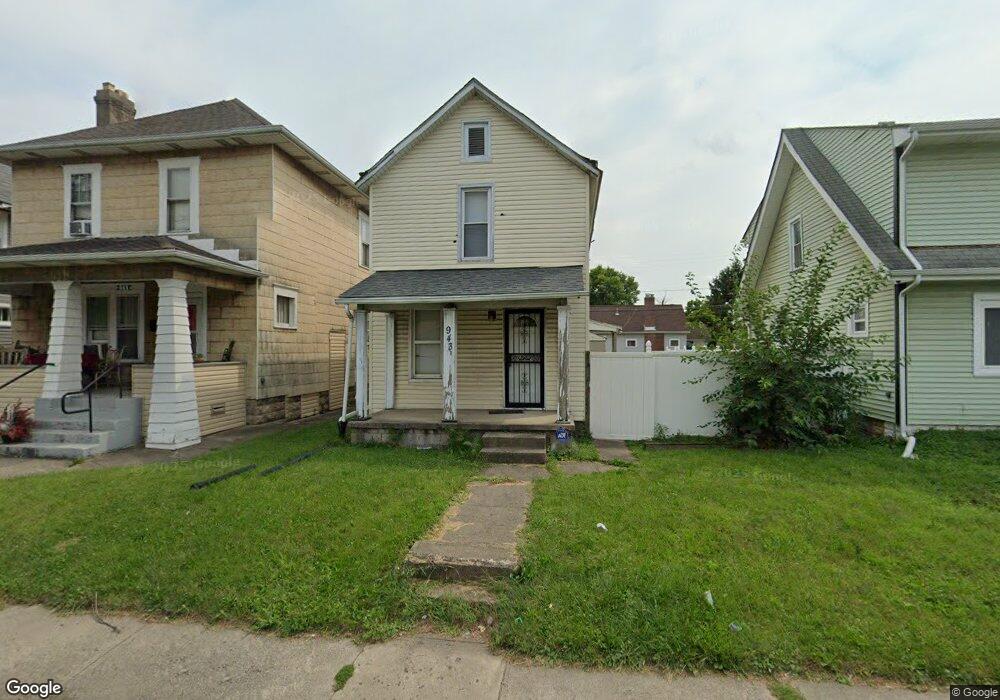
943 E 17th Ave Columbus, OH 43211
South Linden NeighborhoodEstimated Value: $123,000 - $161,000
3
Beds
1
Bath
1,344
Sq Ft
$103/Sq Ft
Est. Value
About This Home
This home is located at 943 E 17th Ave, Columbus, OH 43211 and is currently estimated at $137,951, approximately $102 per square foot. 943 E 17th Ave is a home located in Franklin County with nearby schools including Windsor Stem Acadmey, Linden-Mckinley Stem School On Arcadia, and North Columbus Preparatory Academy.
Ownership History
Date
Name
Owned For
Owner Type
Purchase Details
Closed on
Jun 9, 2017
Sold by
Smalley Jason P
Bought by
Smalley Robert L
Current Estimated Value
Purchase Details
Closed on
Jan 14, 2005
Sold by
Smalley Linda L
Bought by
Smalley Robert L and Smalley Jason P
Home Financials for this Owner
Home Financials are based on the most recent Mortgage that was taken out on this home.
Original Mortgage
$50,000
Interest Rate
8.4%
Mortgage Type
Purchase Money Mortgage
Purchase Details
Closed on
Mar 29, 2002
Sold by
Lehnert James A and Lehnert Timothy P
Bought by
Smalley Linda L and Smalley Robert L
Home Financials for this Owner
Home Financials are based on the most recent Mortgage that was taken out on this home.
Original Mortgage
$24,000
Interest Rate
6.82%
Mortgage Type
Seller Take Back
Purchase Details
Closed on
Dec 17, 1985
Bought by
Lehnert James A
Purchase Details
Closed on
Oct 1, 1983
Create a Home Valuation Report for This Property
The Home Valuation Report is an in-depth analysis detailing your home's value as well as a comparison with similar homes in the area
Home Values in the Area
Average Home Value in this Area
Purchase History
| Date | Buyer | Sale Price | Title Company |
|---|---|---|---|
| Smalley Robert L | $13,200 | Great American Title | |
| Smalley Robert L | -- | -- | |
| Smalley Linda L | $26,000 | -- | |
| Lehnert James A | $8,500 | -- | |
| -- | $7,500 | -- |
Source: Public Records
Mortgage History
| Date | Status | Borrower | Loan Amount |
|---|---|---|---|
| Previous Owner | Smalley Robert L | $50,000 | |
| Previous Owner | Smalley Linda L | $24,000 |
Source: Public Records
Tax History
| Year | Tax Paid | Tax Assessment Tax Assessment Total Assessment is a certain percentage of the fair market value that is determined by local assessors to be the total taxable value of land and additions on the property. | Land | Improvement |
|---|---|---|---|---|
| 2025 | $2,469 | $35,420 | $5,320 | $30,100 |
| 2024 | $2,469 | $35,420 | $5,320 | $30,100 |
| 2023 | $1,569 | $35,420 | $5,320 | $30,100 |
| 2022 | $652 | $12,570 | $2,210 | $10,360 |
| 2021 | $653 | $12,570 | $2,210 | $10,360 |
| 2020 | $746 | $12,570 | $2,210 | $10,360 |
| 2019 | $738 | $10,580 | $1,860 | $8,720 |
| 2018 | $361 | $10,580 | $1,860 | $8,720 |
| 2017 | $627 | $10,580 | $1,860 | $8,720 |
| 2016 | $612 | $9,240 | $2,100 | $7,140 |
| 2015 | $278 | $9,240 | $2,100 | $7,140 |
| 2014 | $557 | $9,240 | $2,100 | $7,140 |
| 2013 | $306 | $10,290 | $2,345 | $7,945 |
Source: Public Records
Map
Nearby Homes
- 957 E 17th Ave
- 1705 Lexington Ave
- 914-916 E 17th Ave
- 0 E 18th Ave
- 1045-1051 E 20th Ave
- 1027 E 14th Ave
- 915 E 13th Ave
- 1129 E 17th Ave
- 1047 E 21st Ave
- 1538-1542 Accommodation Ave
- 990 E 21st Ave
- 1033 E 22nd Ave
- 1673 Cleveland Ave
- 957 E 12th Ave
- 1109 Windsor Ave Unit 1103
- 1136 E 21st Ave
- 1111 Windsor Ave
- 1121 Windsor Ave
- 1449 Jefferson Ave
- 1129 E 23rd Ave Unit 1129 - 1131
- 949 E 17th Ave
- 939 E 17th Ave
- 951 E 17th Ave Unit 953
- 951-953 E 17th Ave
- 1716 Jefferson Ave
- 927 E 17th Ave
- 961 E 17th Ave
- 923 E 17th Ave
- 1708 Jefferson Ave
- 1709 Lexington Ave
- 965 E 17th Ave Unit 967
- 950 E 17th Ave
- 948-950 E 17th Ave
- 919 E 17th Ave
- 948 E 17th Ave Unit 950
- 940 E 17th Ave
- 1717 Jefferson Ave
- 954 E 17th Ave
- 1702 Jefferson Ave
- 1701 Lexington Ave
Your Personal Tour Guide
Ask me questions while you tour the home.